Hello! Welcome to the first lesson of Module 2, "Thinking in Systems: Modeling Products."
In our last module, we built a foundation by looking at APIs, cost modeling, and data freshness. We concluded by exploring Goodhart's Law, where we saw that focusing on a single metric can lead to unintended, counter-productive outcomes. This is a classic systems problem: a seemingly simple action (setting a target) can cause complex, negative ripples throughout the entire system.
Today, we will start building the toolkit to formally analyze these dynamics. To do that, we need a shared language. This lesson is dedicated to learning the fundamental vocabulary of systems thinking. Our goal is to define a system in terms of stocks, flows, and feedback loops. These three concepts are the essential building blocks we will use to model and understand the products and organizations we design for.
1. A Visual Introduction to Systems Thinking
Before we break down the definitions, let's get an intuitive feel for these concepts in action. The Donella Meadows Institute, founded by one of the pioneers of the field, created a wonderful animated video that introduces all the key ideas we'll cover today.
The video 'In A World of Systems' provides an excellent, animated introduction to the core concepts of systems thinking using relatable examples like a shower and a traffic jam.
Please watch the following segments: What is a system? (00:50 - 01:25) The balancing feedback loop (01:12 - 02:24) Stocks and flows (02:50 - 03:26) The reinforcing feedback loop (04:41 - 05:48) As you watch, notice how these simple components combine to create both stable (the shower temperature) and unstable (the traffic jam) behavior.
The video introduced all the key terms for today. Now, let's formalize them and see how they apply to the world of product design.
2. The Anatomy of a System
As the video explained, a system is an interconnected set of elements organized to achieve a purpose. This definition has three key parts:
- Elements: The individual parts of the system.
- Interconnections: The relationships between the elements. These are often flows of information or materials.
- Purpose or Function: What the system does. This can be an explicit goal or an emergent behavior.
Your mechanical engineering background provides many examples. A car's cooling system has elements (radiator, pump, thermostat, coolant), interconnections (hoses, sensor signals), and a purpose (to keep the engine at its optimal operating temperature).
Digital products are systems, too. An e-commerce site has elements (users, products, servers, databases), interconnections (user actions, API calls, data flows), and a purpose (to facilitate transactions and generate revenue).
To understand a system's behavior over time, we need to focus on two specific types of elements and interconnections: stocks and flows.
Stocks and Flows
Let's refine the concepts from the video with a classic analogy: the bathtub.
Chapter 2: Systems Thinking: a New Way to Tackle Problems
The online textbook 'Systems Thinking: a New Way to Tackle Problems' from James Madison University provides a clear, detailed explanation of stocks and flows. This will help solidify what you saw in the video.
Please read Section 2.4.1, 'Introducing Stocks and Flows'. This section uses the bathtub analogy to explain these core concepts.
To summarize the reading:
- A Stock is an accumulation of something over time. It represents the memory of the system. You can think of it as a noun. At any moment, you could freeze time and measure the stock. In the diagram below, the rectangle represents a stock.
- A Flow is the rate at which a stock changes. Flows are the actions or processes that fill or drain the stock. You can think of them as verbs. Inflows increase the stock, and outflows decrease it. The pipes with valves represent flows.

Let's map this to a product context:
- Product: A SaaS application.
- Stock:
Number of Active Subscribers. - Inflow:
New Subscriptions per Month. - Outflow:
Cancellations per Month.
The Number of Active Subscribers at the end of the month is the number from the start of the month, plus all the new subscriptions, minus all the cancellations. The stock is a snapshot; the flows drive its change over time.
3. Feedback Loops: The Engine of Behavior
The most powerful aspect of systems thinking comes from understanding feedback loops. A feedback loop occurs when the level of a stock influences the rate of its own inflows or outflows. This is what makes systems dynamic and often surprising.
There are two fundamental types of feedback loops: balancing and reinforcing.
Balancing Feedback Loops
A balancing loop (also called a negative feedback loop) is goal-seeking and stabilizing. It tries to bring a stock to a desired level and keep it there. Think of the thermostat in your home.
- Stock:
Room Temperature - Goal: 21°C
- Process: If
Room Temperature> 21°C, the balancing loop turns on the AC (an outflow of heat) to bring the temperature down. IfRoom Temperature< 21°C, it turns on the heat (an inflow of heat) to bring it up.
The loop is constantly trying to close the gap between the current state and the goal.
Reinforcing Feedback Loops
A reinforcing loop (also called a positive feedback loop) is amplifying. It creates exponential growth or collapse. The more you have, the more you get (or lose). Think of a viral social media post.
- Stock:
Number of People Who Have Seen the Post - Process: The more people see the post, the more they share it (inflow of views from shares). This increases the stock of viewers, which leads to even more shares. It's a snowball effect.
Let's use the textbook again to see these loops described in a different context.
Chapter 2: Systems Thinking: a New Way to Tackle Problems
The same textbook chapter provides clear definitions for both types of feedback loops using a population dynamics example.
Please read Section 2.3.3, 'Balancing Feedback,' and Section 2.3.4, 'Reinforcing Feedback.' Notice how the deer population is influenced by both a reinforcing birth loop and a balancing death loop.
4. Putting It All Together: A Product Growth Model
Nearly every product contains a mix of both reinforcing and balancing loops. Identifying them is the first step to understanding why a product succeeds, stagnates, or fails.
Let's look at a common systems diagram for product adoption.
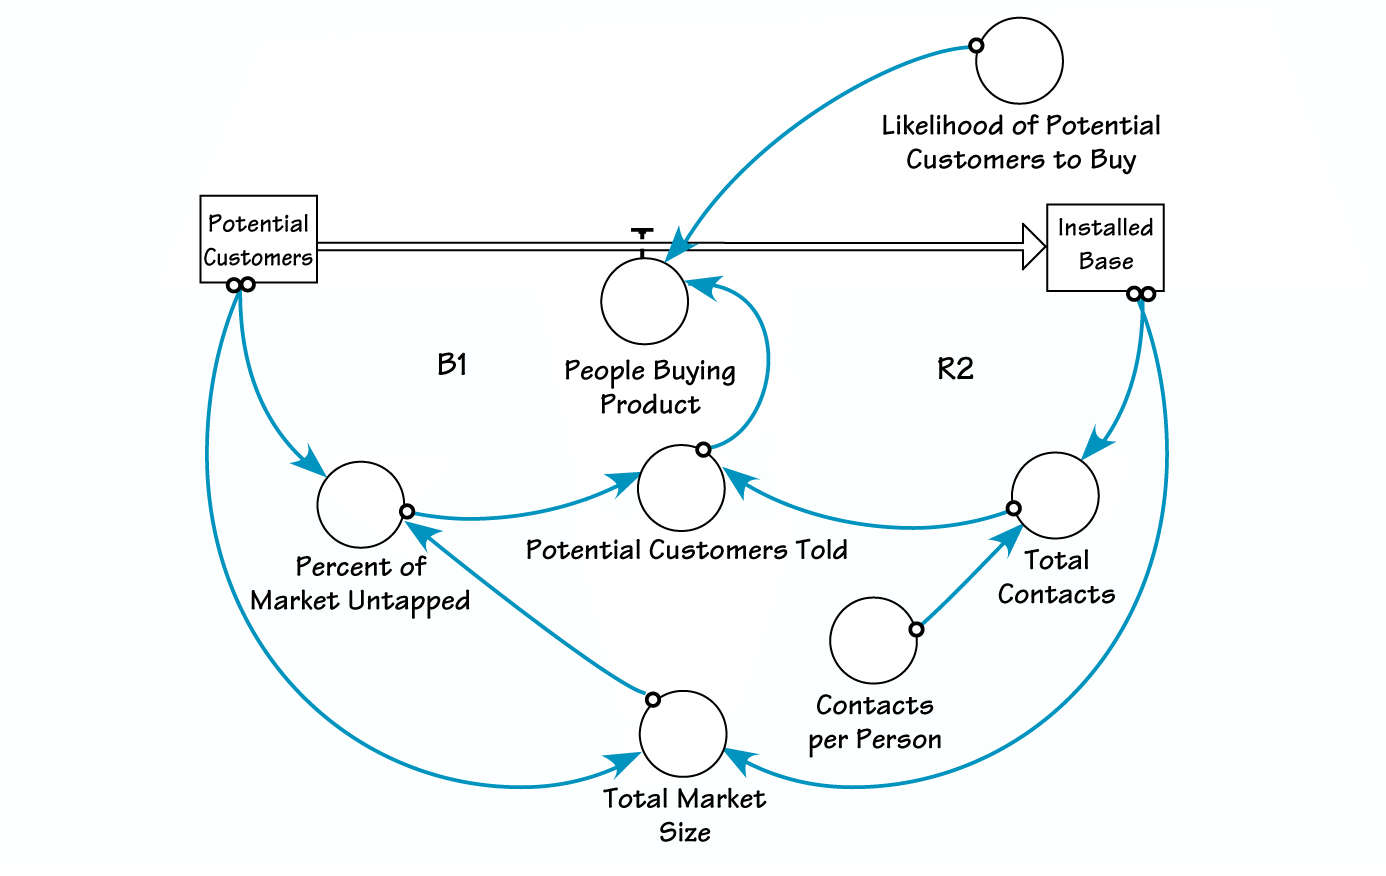
Let's trace the loops in this diagram:
-
Reinforcing Loop (R2 - Word of Mouth):
- An increase in the
Installed Base(stock) leads to... - more
Total Contactswith potential customers, which leads to... - more
Potential Customers Toldabout the product, which increases the... Likelihood of Potential Customers to Buy, which increases the...People Buying Product(inflow), which further increases theInstalled Base.
This is the engine of viral growth. The more users you have, the faster you get new ones.
- An increase in the
-
Balancing Loop (B1 - Market Saturation):
- An increase in the
Installed Base(stock)... - decreases the
Percent of Market Untapped, which decreases the... Likelihood of Potential Customers to Buy, which slows down the...People Buying Product(inflow), which constrains the growth of theInstalled Base.
This is a limiting factor. As you capture more of the market, it becomes harder and harder to find new customers, and growth naturally slows down.
- An increase in the
As a UI/UX designer, you can influence these loops. A referral feature in your product directly strengthens the R2 reinforcing loop. A clear and simple onboarding process reduces friction, increasing the rate of the "People Buying Product" flow.
Conclusion
In this lesson, we've defined the foundational language of systems thinking. Understanding these concepts is the first step toward seeing the invisible structures that drive behavior in the products you help create.
Key Takeaways:
- A system consists of elements, interconnections, and a purpose.
- Stocks are accumulations of resources or quantities in a system (e.g., users, money, data). They provide the system's memory.
- Flows are the rates of change that increase (inflows) or decrease (outflows) the stocks over time.
- Feedback loops occur when a stock's level influences its own flows.
- Balancing loops are goal-seeking and create stability.
- Reinforcing loops are amplifying and create exponential growth or decline.
Next Lesson Preview:
Now that we have this vocabulary, our next lesson will be more hands-on. We'll practice identifying reinforcing and balancing feedback loops in written product scenarios. This will build your analytical skills and prepare you to start drawing your own causal loop diagrams—the primary tool for mapping and communicating the structure of a system.