Introduction
Hello! Welcome to our final lesson in the module on designing for data flow and freshness. In our previous lesson, we dove into the granular details of audit trails, specifying how to record every critical event to ensure decision traceability. This gave us a micro-view of data—the system's immutable memory.
Today, we're zooming out to take a macro-view. We'll explore how to visualize the entire journey of data through a system using Data Flow Diagrams (DFDs). This lesson directly addresses the learning outcome: Create a data flow diagram for a dashboard, highlighting sources, delays, and user-facing components.
As a UI/UX designer, you are an expert at mapping user flows. A DFD is similar, but instead of tracking a user's actions, it tracks the flow of data. Understanding how to create and read these diagrams is a critical skill for an architect, as it allows you to visualize the technical backbone that supports the user experience you design. This is where the UI meets the architecture.
1. The Language of Data Flow: DFD Fundamentals
A Data Flow Diagram is a graphical representation of how information moves through a system. It answers four key questions:
- Where does data come from?
- What happens to it?
- Where is it stored?
- Where does it end up?
To learn the basic vocabulary and symbols of DFDs, please watch the following video. It provides a clear and concise introduction to the four fundamental components.
Data Flow Diagram EXAMPLE [How to Create Data Flow Diagrams]
The video 'Data Flow Diagram EXAMPLE' by The Business Analysis Doctor introduces the core concepts. Pay close attention to the four main components and their visual representations.
Please watch from the beginning until 06:02. Focus on understanding these four elements: External Entities: The sources and destinations of data (e.g., users, other systems). Processes: The actions that transform data. Data Stores: Where data is held for later use. Data Flows: The paths the data takes between the other components.
To summarize, every DFD is built from just four symbols:
- Squares for External Entities.
- Rounded Rectangles for Processes.
- Open-ended Rectangles for Data Stores.
- Arrows for Data Flows.
Given your experience with diagramming in Figma, these conventions should feel familiar. The key is to shift your thinking from user actions to data transformations.
2. Decomposing Complexity with DFD Levels
Systems are complex. Trying to map every single data flow on one diagram would be unreadable. DFDs solve this by using a hierarchical structure with different levels of detail.
- Context Diagram (or Level 0): This is the highest-level view. It shows the entire system as a single process and illustrates how it interacts with external entities. It defines the system's boundary.
- Level 1 Diagram: This "explodes" the single process from the Context Diagram into its major sub-processes. At this level, you start to introduce data stores.
- Level 2 and beyond: These diagrams provide even more detail by exploding a process from the Level 1 diagram. You typically don't need to go beyond Level 2 or 3 to have a clear understanding.
Let's continue with the video to see how these levels work in practice.
Data Flow Diagram EXAMPLE [How to Create Data Flow Diagrams]
We'll now watch the part of the 'Data Flow Diagram EXAMPLE' video that explains the different DFD levels using a practical example for Amazon.
Please watch from 06:02 to 10:07, and then from 11:41 to 16:12. Focus on: How a Context Diagram sets the stage. How a Level 0 Diagram breaks down the main system into primary processes. How a Level 1 Diagram zooms into one of those primary processes for more detail.
This concept of progressive disclosure is something you likely use in UX design. A DFD applies the same principle to system architecture, allowing you to communicate with different stakeholders at the appropriate level of detail.
3. Visualizing Delays and Data Freshness
Now, let's connect DFDs to a core theme of this module: data freshness. A standard DFD doesn't have a symbol for "delay," but as an architect, you must represent it. You can do this by showing how the data is processed and stored.
Different architectural patterns result in different data latencies.

We can embed this information in a DFD by choosing our processes and data stores carefully and annotating them.
- Real-time / Streaming (Seconds to Minutes): Data flows from a source, through a
Stream Processingengine (like Apache Spark or Flink), and into aReal-time Cacheor directly to the UI. The flow is continuous. - Batch (Hours to Days): Data is collected, flows through a
Batch Processingjob, and is stored in aData WarehouseorData Lake. This process runs on a schedule (e.g., nightly).
Let's look at a comprehensive data architecture diagram. Notice the two distinct paths data can take.
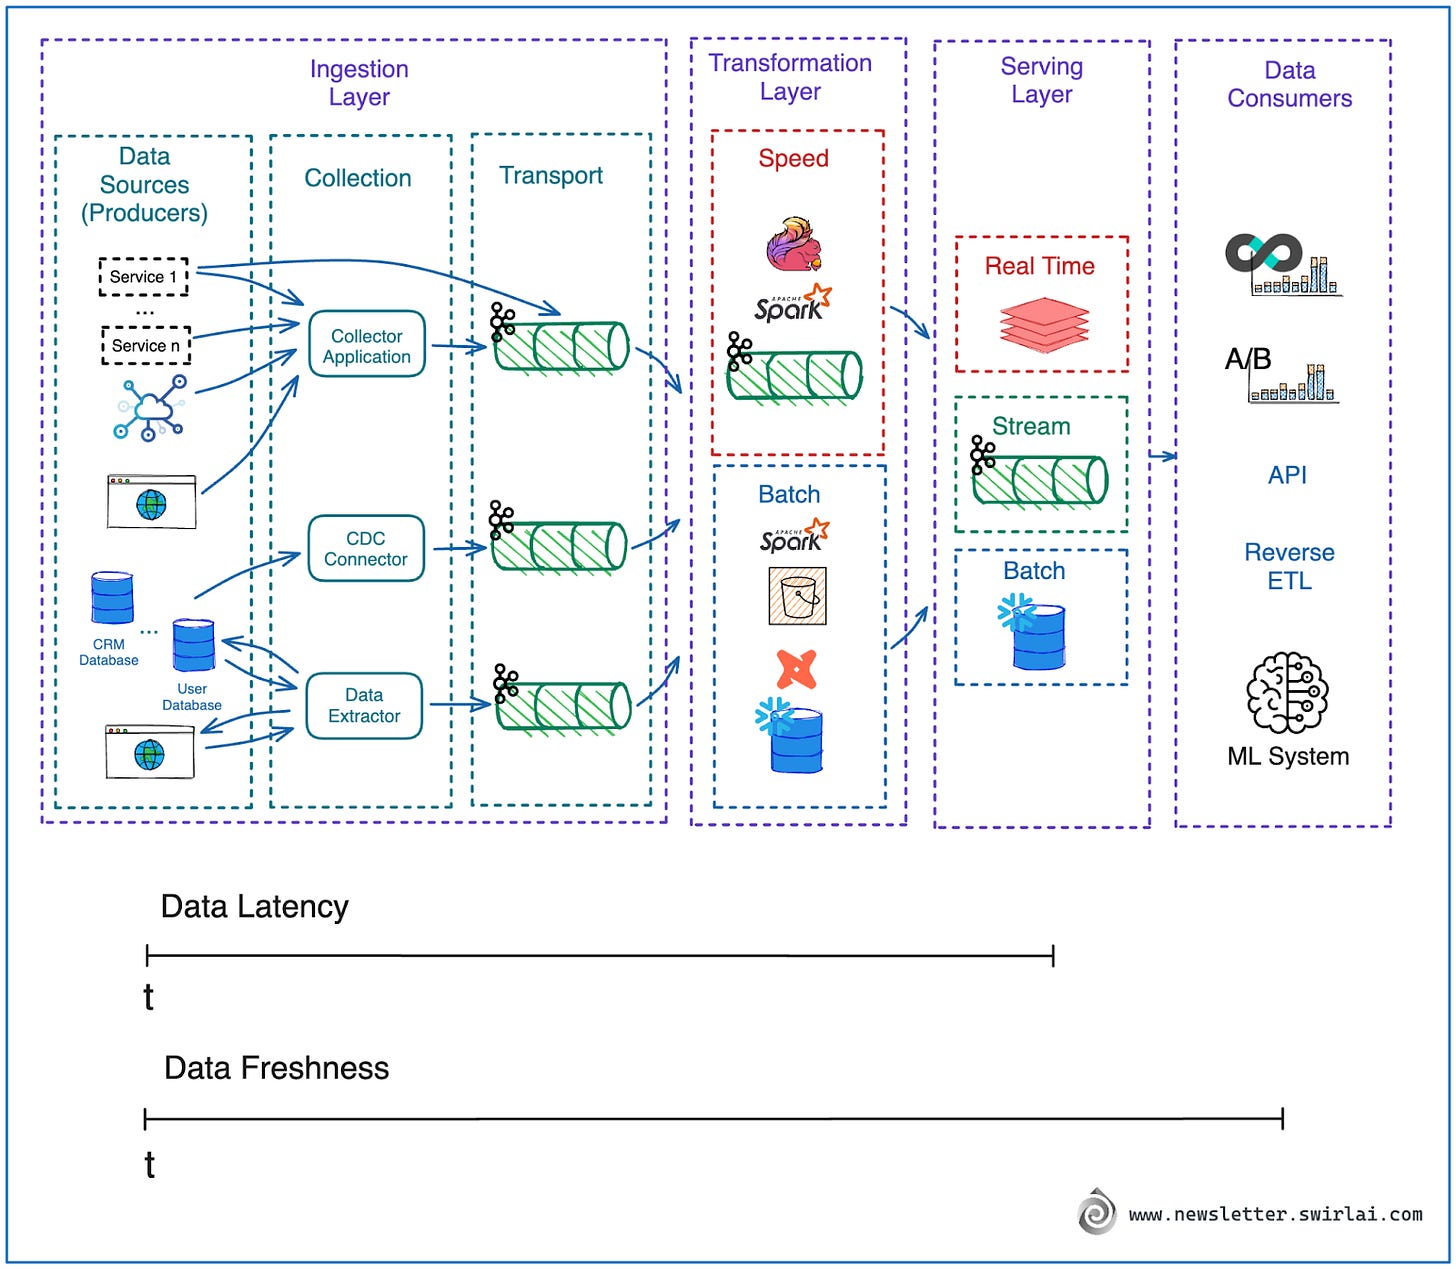
When you create your DFD, you can add annotations like "Updated every 15 mins" or "Nightly Batch Job" to data flows or data stores to make the delays explicit.
This directly connects to the user experience. As a UI designer, you create patterns to manage user expectations around stale data. The DFD shows the underlying architectural reason why that data is stale.
From Data To Decisions: UX Strategies For Real-Time ...
Recall the article on UX strategies for real-time dashboards. Let's revisit the section on making reliability visible, which introduces a specific UI component for this purpose.
Please read the short subsection titled 'Data Freshness Indicator.' Notice how this UI pattern is a direct, user-facing consequence of the architectural decisions we are modeling in a DFD.
A "Data Freshness Indicator" on a dashboard is the user-facing part of a data flow that has a significant delay. The DFD helps you, the architect, trace that indicator all the way back to its source and understand the processes that contribute to its delay.
4. Your Turn: Create a Dashboard DFD
It's time to put this all together. Your task is to apply these concepts to design a DFD for a dashboard.
Scenario:
You are designing a sales dashboard for an e-commerce platform. The dashboard has three main components for the sales manager:
- Live Sales Ticker: Shows the total value of sales in the last minute. This data needs to be near real-time.
- Top Products Table: A table showing the top 10 best-selling products in the last hour. This can have a few minutes of delay.
- Regional Performance Chart: A bar chart comparing monthly sales revenue across different regions. This data is compiled from a data warehouse and is updated once every 24 hours. A "Last updated" timestamp is shown next to this chart.
Your Task:
Create a Level 1 Data Flow Diagram for this sales dashboard system. Since you're comfortable with Figma, you can use FigJam or a similar tool. Make sure your diagram includes:
- External Entities: At least one, the
Sales Managerwho views the dashboard. - Data Sources: What are the original sources of sales data? Think about where live transactions are recorded versus where historical data is stored.
- Processes: Identify the key transformations needed. You'll need different processes for the real-time, hourly, and daily data aggregations. Name them clearly (e.g.,
Stream Live Sales Data,Aggregate Hourly Product Sales,Calculate Monthly Regional Revenue). - Data Stores: Identify the different databases or caches needed to support the different freshness requirements.
- Data Flows: Connect all the components with clearly labeled arrows.
- Annotations for Delay: Crucially, add text annotations to your diagram to indicate the freshness of the data for each of the three main data paths (e.g., "Updated every 60s," "Updated every hour," "Updated every 24h").
This exercise will solidify your understanding of how to translate system requirements for a user-facing product into a clear architectural diagram.
Conclusion
In this lesson, you've learned how to use Data Flow Diagrams to create a high-level map of a system's data architecture. This powerful tool bridges the gap between technical implementation and user experience, which is central to your role as a Decision Systems Architect.
Key Takeaways:
- DFDs visualize data movement using four simple symbols: entities, processes, data stores, and data flows.
- Complexity is managed through levels of decomposition, from high-level Context Diagrams to detailed Level 1 and 2 diagrams.
- Delays and data freshness are represented architecturally through the choice of processing methods (streaming vs. batch) and data stores, which can be explicitly annotated on the DFD.
- User-facing components, like a "data freshness indicator," are the final step in a data flow and are a direct result of the underlying system architecture.
Next Steps
This lesson concludes Module 7: Designing for Data Flow & Freshness. You are now equipped with the tools to model, analyze, and design how data moves through complex systems, from the high-level flow to the low-level audit trail.
In our next lesson, we will begin Module 8: Engineering Trust in AI Systems. Our first topic will be to distinguish between System 1 (intuitive) and System 2 (deliberate) thinking in the context of user interaction with AI. We will shift our focus from the mechanics of the system to the psychology of the user, a crucial foundation for designing AI systems that people can understand and trust.