Hello! Welcome back to our work on Economic Modeling.
In our last lesson, you did an excellent job modeling the cost structure for a new SaaS feature, breaking it down into its core components: one-time Build Costs and recurring Infrastructure and Support Costs. That gave us one side of the economic equation.
Today, we'll build the other side. This lesson directly addresses your next learning outcome: to model the revenue projections for a SaaS feature based on user growth and pricing.
Just as an engineer needs to know the expected load on a beam to assess its design, a systems architect needs to project a feature's revenue to assess its business viability. Understanding revenue drivers allows you to participate in strategic conversations about which features to build, how to price them, and what makes a feature truly successful—not just for the user, but for the entire system.
1. The Language of SaaS Revenue: MRR and ARR
The most important metric in a subscription business is Monthly Recurring Revenue (MRR). It represents the predictable revenue a company can expect to receive every month. This predictability is what makes SaaS businesses so powerful.
To get a formal definition of MRR and its components, let's start with a brief reading.
SaaS Financial Model For Startups & SMBs
The article 'SaaS Financial Model For Startups & SMBs' from Chargebee provides clear definitions for the key revenue terms we will be using.
Please read the sections 'Revenue Models' and 'How to Use the SaaS Financial Model Template?', focusing on step 1 under the 'Revenue Report' heading. Pay close attention to the components that make up your final revenue: New, Expansion, Downgrade, and Churn.
From the reading, we can establish the fundamental equation for MRR growth:
Ending MRR = Starting MRR + New MRR + Expansion MRR - Downgrade MRR - Churn MRR
Let's break that down:
- New MRR: Revenue from brand new customers.
- Expansion MRR: Additional revenue from existing customers (e.g., upgrading their plan).
- Downgrade MRR: Revenue lost from existing customers moving to a cheaper plan.
- Churn MRR: Revenue lost from customers canceling their subscriptions entirely.
For our model today, we will focus on the two most significant drivers: New MRR and Churn MRR. We'll also touch on its annualized counterpart, Annual Recurring Revenue (ARR), which is simply MRR * 12.
2. Projecting User Growth: The Funnel
New MRR comes from new customers. But where do new customers come from? They move through a user acquisition funnel. As a UX designer, you're already familiar with this journey, which often starts with a website visit and hopefully ends with a subscription.
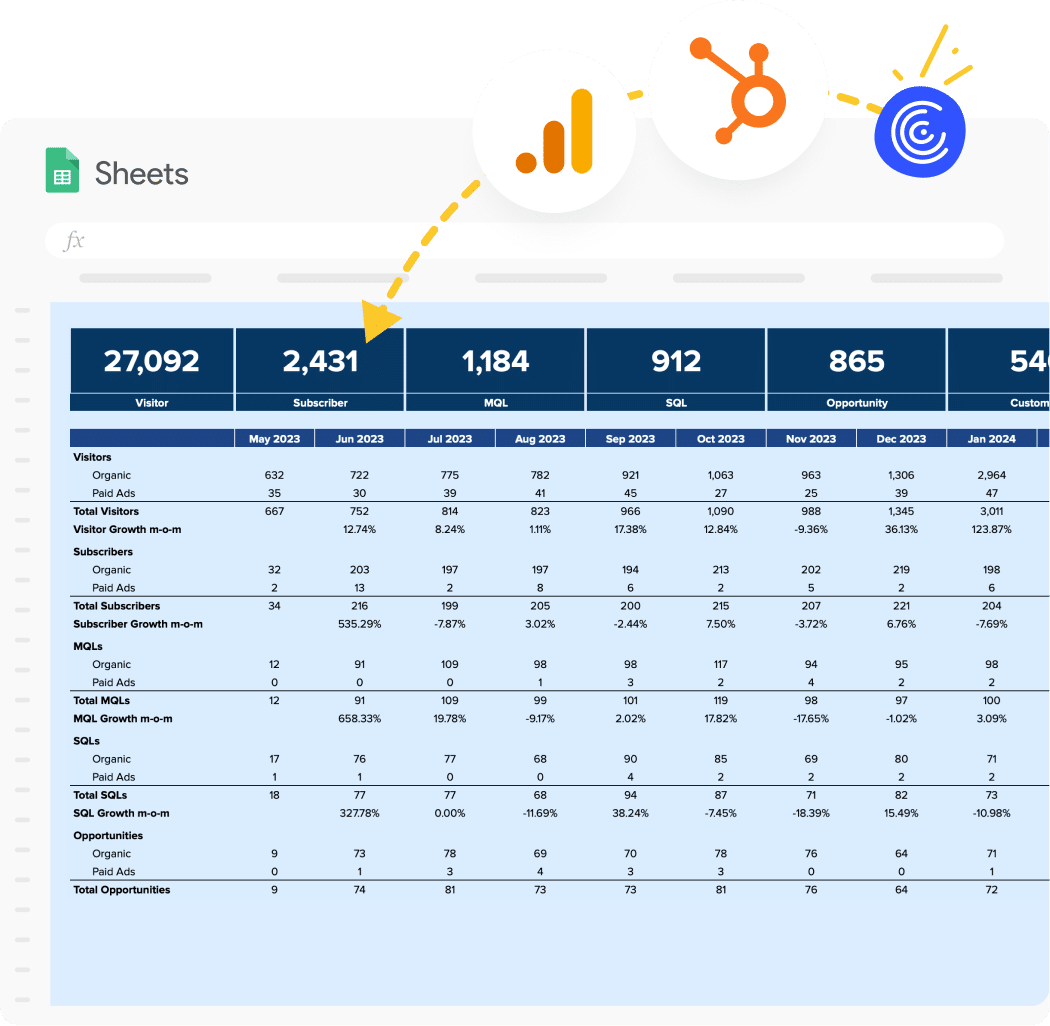
Tracking this funnel is key to creating a sophisticated revenue model. For our purposes, we will simplify the top of the funnel and start our model with a core assumption: the number of new paying customers we acquire each month.
3. Building a Revenue Model in a Spreadsheet
The best way to understand revenue dynamics is to build a model yourself. We'll use a spreadsheet to project revenue over a 12-month period.
The following video provides an excellent, step-by-step guide to creating a basic but powerful SaaS revenue model. We'll watch it in two parts.
First, let's learn how to model the flow of customers: adding new ones and losing some to churn.
How To Create A SaaS Revenue Forecast Model In Excel
The video 'How To Create A SaaS Revenue Forecast Model In Excel' by HowToAnalyst is a perfect introduction to building a revenue model from scratch. We'll start with the core mechanics of customer growth and churn.
Watch the segment from the beginning to 05:26. Focus on how the spreadsheet is structured with these key rows: Ads (Adds): The number of new customers acquired each month. Drops: The number of customers who churn (cancel). Net Customers: The total number of active customers at the end of the month. Note the formula for this: Previous Month's Net Customers + Current Month's Adds - Current Month's Drops. Also, pay close attention to how the monthly revenue is calculated at the end of this segment.
This first part of the video establishes the engine of our model: the "bathtub" of customers, where new customers are the inflow from the faucet and churned customers are the outflow through the drain.
4. Incorporating Pricing and Scenarios
Now that we have a projected number of customers for each month, the next step is to multiply that by the price they pay. This gives us our MRR. SaaS products often have multiple pricing tiers, so we need a way to account for that.
Let's continue with the same video to see how to handle different price points and create scenarios.
How To Create A SaaS Revenue Forecast Model In Excel
Let's continue with the 'How To Create A SaaS Revenue Forecast Model In Excel' video to learn how to incorporate pricing.
Please watch two more segments: Scenario Planning (05:26 - 06:48): This short section shows how you can quickly create a range of outcomes by changing your input assumptions (like new customers and churn rate). This is a vital part of financial modeling. Weighted Average MRR (06:48 - 08:44): This is a crucial technique. It shows how to calculate a single, blended 'Average Revenue Per User' (ARPU) when you have multiple pricing tiers. This makes your model much more realistic.
By calculating a weighted average MRR, you can model the revenue from a diverse customer base without needing a separate calculation for every single pricing plan.
5. Your Turn: Model a Feature's Revenue
It's time to apply these concepts. Let's create a revenue model for a premium version of the "In-app notifications" feature we costed out in the previous lesson.
Scenario: You are launching a "Pro" tier for your notification feature. This tier will cost $15/month. Based on market research, you project the following:
- New Customers: You will sign up 50 new "Pro" customers every month.
- Churn Rate: 3% of your "Pro" customers will cancel their subscription each month.
Instructions:
- Open a new spreadsheet in Google Sheets or Excel.
- Set up a 12-month timeline across the columns (Jan, Feb, ..., Dec, Total).
- Create rows for your inputs and calculations, following the structure from the LINK video:
- Inputs:
- New Customers / mo (50)
- Churn Rate (3%)
- MRR / Customer ($15)
- Model:
New Customers(This will be 50 each month)Churned Customers(This isPrevious Month's Total Customers * Churn Rate. Remember to round this to a whole number, as you can't lose a fraction of a customer. It will be 0 for the first month).Total Customers(This isPrevious Month's Total Customers + New Customers - Churned Customers).MRR(This isTotal Customers * MRR / Customer).
- Inputs:
- Fill out the model for all 12 months.
- Calculate the
Totalrevenue for the year in the final column.
Take about 15 minutes for this exercise. The goal is to build a functioning model that correctly projects the growth of your customer base and revenue over time.

Conclusion
Excellent work. You have now modeled the second, and arguably more exciting, half of the economic equation. You've seen how simple inputs—new user acquisition, churn rate, and pricing—combine to create a predictable and growing stream of recurring revenue.
Key Takeaways:
- Monthly Recurring Revenue (MRR) is the foundational metric for valuing a SaaS business, calculated from new, expansion, downgrade, and churned revenue.
- A revenue model projects the flow of customers over time: new customers are added, and a percentage of existing customers churn.
- The total number of customers multiplied by the Average Revenue Per User (ARPU) determines the MRR for any given month.
- Building this in a spreadsheet allows you to test assumptions and run scenarios, turning your projections into a powerful decision-making tool.
Next Lesson Preview
You have now built a cost model and a revenue model. The next logical step is to put them together. In our next lesson, we will combine cost and revenue models to calculate the break-even timeline for a feature. This is where we determine the ultimate question: "When will this feature pay for itself and start generating a profit?"