Hello! Welcome back to our work on modeling product economics.
In our last two lessons, you built the two fundamental pillars of a feature's financial model. First, you modeled the cost structure, identifying the one-time build costs and recurring operational expenses. Then, you created a revenue model, projecting the flow of Monthly Recurring Revenue (MRR) based on user growth and churn.
Today, we bring those two pillars together to answer the ultimate business question: "When does this feature start making money?" This lesson is designed to help you achieve the next learning outcome: to combine cost and revenue models to calculate the break-even timeline for a feature.
As a systems architect, calculating the break-even point is not just an accounting exercise. It's a critical piece of strategic analysis that determines a feature's viability. The result of this analysis directly informs decisions about resource allocation, pricing strategies, and the overall product roadmap.
1. Understanding Break-Even Analysis
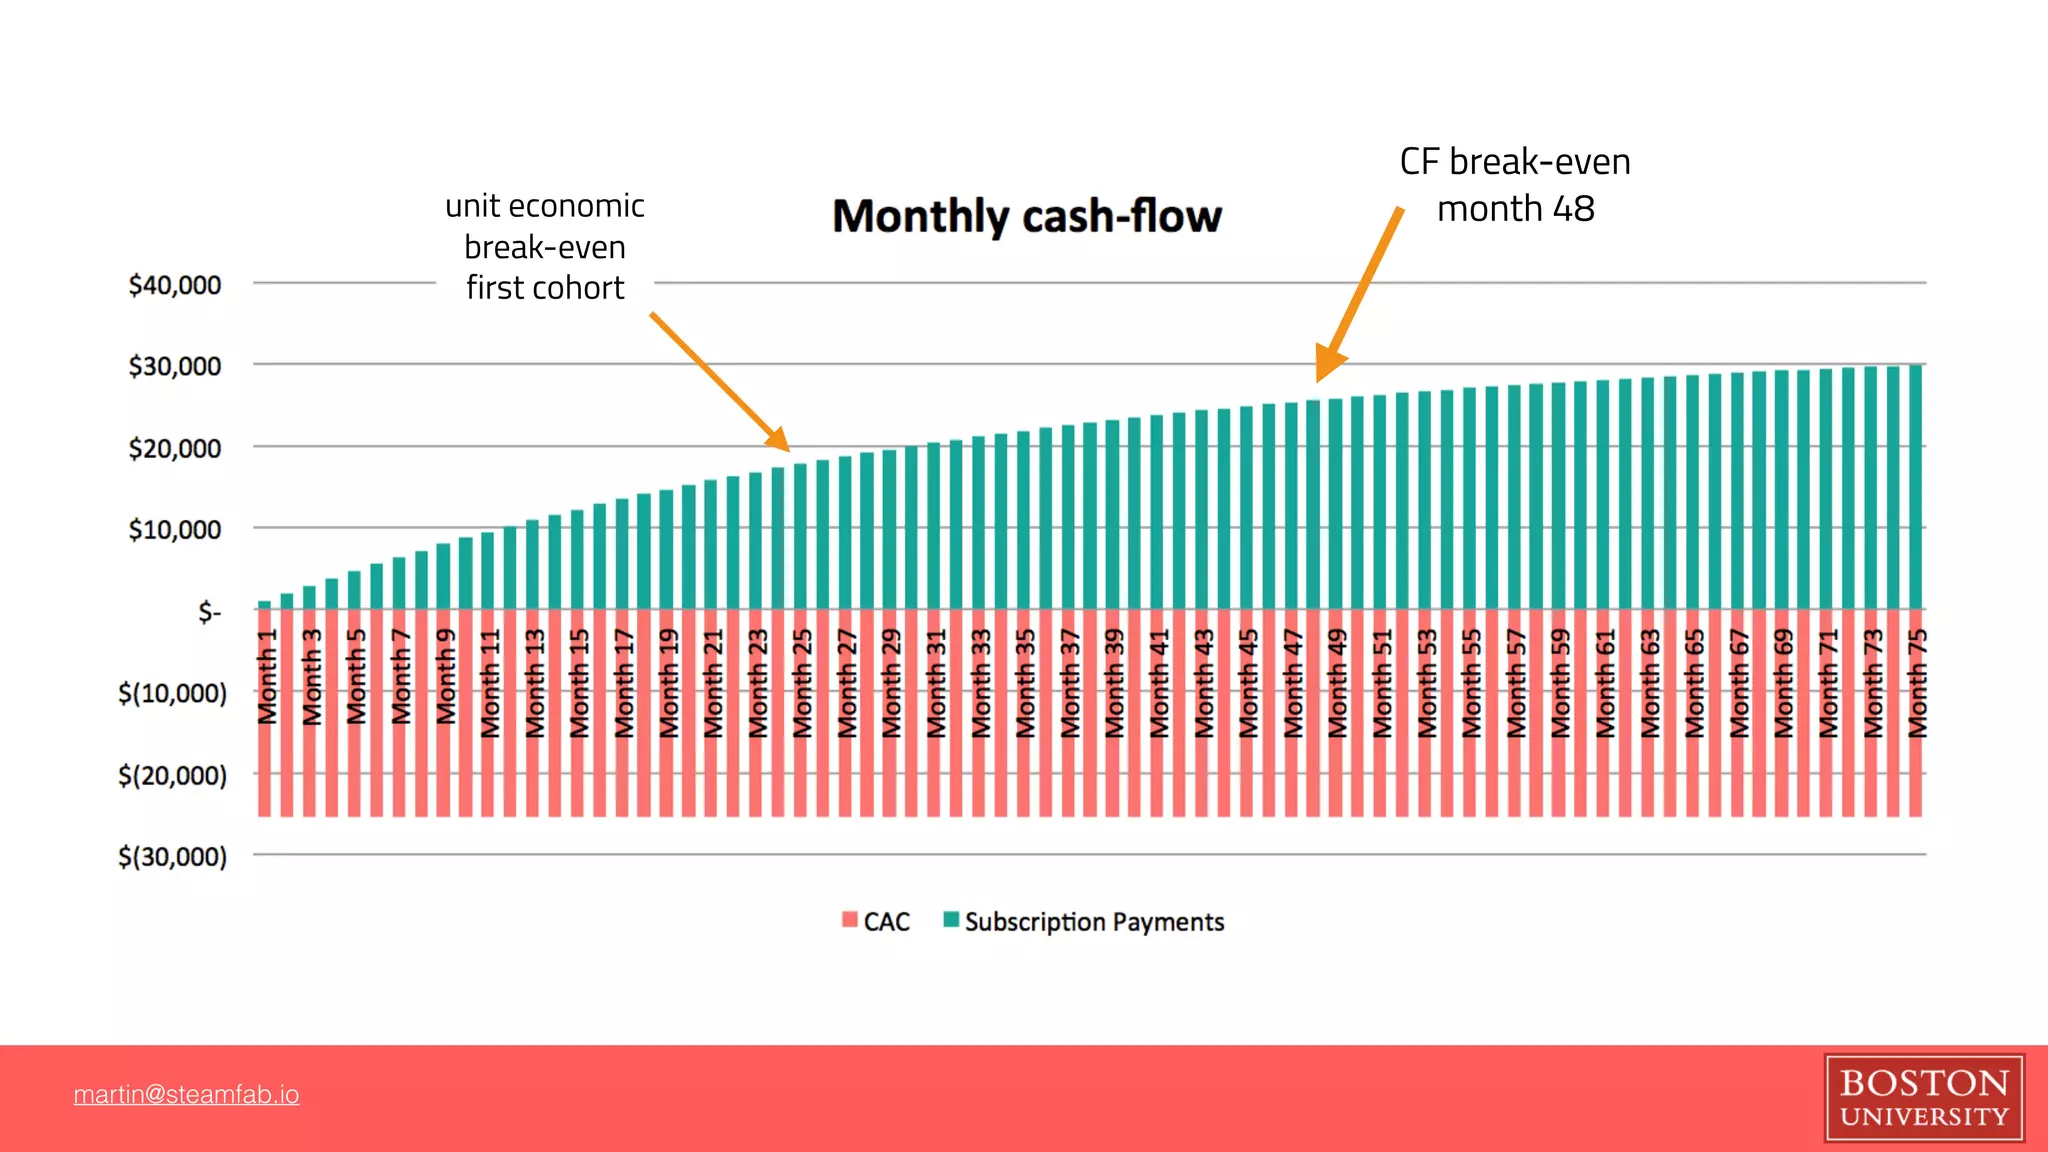
The break-even point is the moment when a project's total revenue equals its total costs. Before this point, the feature is operating at a loss, accumulating a deficit from its initial investment. After this point, it begins to generate a profit.
The core idea is to track the net cash flow over time.
- Monthly Net Cash Flow = Monthly Revenue - Monthly Costs
- The break-even point is reached when the Cumulative Net Cash Flow turns from negative to positive.
This is often visualized as the intersection of a total cost line and a total revenue line.

To solidify this concept, let's turn to a short reading.
SaaS Financial Modeling 101: MRR, ARR, LTV/CAC Explained
The article 'SaaS Financial Modeling 101' provides a very clear and concise explanation of break-even analysis in a SaaS context.
Please read 'Step 4: Break-Even Analysis'. Focus on how the break-even point is defined as the moment monthly revenue equals monthly costs, causing cash flow to turn positive.
2. How to Model Break-Even in a Spreadsheet
Now that we understand the 'what' and 'why', let's focus on the 'how'. The key to finding the break-even point is calculating the cumulative costs and revenue over time. A spreadsheet is the perfect tool for this.
The following video demonstrates how to set up this analysis and create a visual chart, which is a powerful way to communicate your findings to stakeholders.
How to make Cost Benefit and Breakeven Analysis in Excel
In the video 'How to make Cost Benefit and Breakeven Analysis in Excel' by David McLachlan, we'll see a practical demonstration of building a break-even model.
Please watch from 07:17 to 11:35. Pay close attention to two key parts: Cumulative Calculation (07:17 - 08:53): This is the most critical part. Observe the Excel formula used to create a running total of costs and benefits (revenue) over time. Creating the Chart (08:53 - 11:35): See how the cumulative data is used to generate a line graph that visually identifies the break-even point. As a designer, you'll appreciate how this visualization makes the data instantly understandable.
The video uses the term "benefits," which in our context is synonymous with revenue. The principle of accumulating costs and revenues over time to find where they intersect is exactly what we need to do.
3. Your Turn: Calculate the Break-Even Timeline
It's time to put everything together. You will now combine the cost and revenue models you developed in the previous lessons to find the break-even point for the "Pro" notification feature.
Assumptions Recap:
- Costs (from Lesson 1):
- Build Cost (One-time): $15,000 (incurred in Month 1)
- Infrastructure & Support (Recurring): $500/month
- Revenue (from Lesson 2):
- Based on acquiring 50 new customers per month at $15/customer, with a 3% monthly churn rate.
Instructions:
- Open the spreadsheet you used in the previous lessons, or start a new one.
- Set up a timeline for at least 36 months. A longer timeline is often needed to see break-even.
- Create the following rows:
- Monthly Revenue: Copy the
MRRcalculations from your revenue model from the last lesson. - Monthly Recurring Costs: This will be
$500for every month. - One-Time Costs: This will be
$15,000in Month 1 and$0for all subsequent months. - Monthly Net Cash Flow: Calculate this as
Monthly Revenue - Monthly Recurring Costs - One-Time Costs. - Cumulative Cash Flow: This is the running total.
- For Month 1, it's equal to the
Monthly Net Cash Flow. - For Month 2 onwards, it's
Previous Month's Cumulative Cash Flow + Current Month's Monthly Net Cash Flow.
- For Month 1, it's equal to the
- Monthly Revenue: Copy the
- Analyze the
Cumulative Cash Flowrow. Identify the month in which the value switches from negative to positive. This is your break-even month. - (Optional but Recommended): Create a line chart with 'Months' on the x-axis and both 'Monthly Revenue' and 'Total Monthly Costs' (
Recurring + One-Time) on the y-axis to visualize the break-even point, similar to the first image in this lesson.
Take about 20 minutes for this exercise. The goal is to have a clear, data-driven answer to the question, "How long until this feature pays for its own investment?"
Conclusion
Congratulations! You have successfully connected the dots from initial investment to eventual profitability. By combining your cost and revenue models, you've created a complete economic forecast for a feature and determined its break-even timeline.
Key Takeaways:
- The break-even point is where Total Revenue equals Total Costs.
- The key to finding it is calculating Cumulative Cash Flow (
Revenue - Costs) over a monthly timeline. - The break-even month is when the Cumulative Cash Flow transitions from a negative to a positive value.
- This timeline is a crucial metric for business strategy, influencing whether a project is approved, accelerated, or reconsidered.
Next Lesson Preview
You've built a powerful financial model. However, models are based on assumptions, and the metrics we choose to track can have unintended consequences. In our next lesson, we will explore this risk. You will learn how to demonstrate in the financial model how optimizing for a single proxy metric can negatively impact long-term value, a concept famously known as Goodhart's Law.