Hello! Welcome back to our module on modeling product economics.
In our previous lessons, you've done the essential work of a product architect: you've built a financial model from the ground up, projecting costs and revenue to determine the break-even timeline for a new feature. Your model shows a clear path to profitability based on a set of stable assumptions.
But what happens when the pressure is on to get to profitability faster? What if a team is incentivized to hit one specific number, like user growth, at all costs?
This lesson will explore the dark side of metrics. You will learn to demonstrate in a financial model how optimizing for a single proxy metric can negatively impact long-term value. This is a critical concept in systems thinking, where a seemingly positive action in one part of the system can create dangerous, unintended consequences elsewhere.
We will ground our discussion in a famous adage known as Goodhart's Law, which is a cornerstone of thinking about metric risk.
1. Goodhart's Law: When a Good Metric Goes Bad
At its core, Goodhart's Law states: "When a measure becomes a target, it ceases to be a good measure."
Metrics are essential; they are snapshots that help us understand a complex reality. But when we mistake the snapshot for reality itself and make it a target, our behavior changes. We start optimizing for the metric, not for the underlying goal the metric was supposed to represent.
To introduce this idea, let's watch a short, engaging video that explains the concept with some classic examples.
The Unintended Consequences of Measuring Things
The video 'The Unintended Consequences of Measuring Things' from iluli by Mike Lamb provides an excellent introduction to Goodhart's Law and the pitfalls of metric fixation.
Please watch from the beginning to 03:38. Pay attention to: The explanation of how metrics simplify reality (and why that's both a strength and a weakness). The 'cobra effect' anecdote. The formal statement of Goodhart's Law and the real-world examples given (crime statistics, exam results, hospital waiting times).
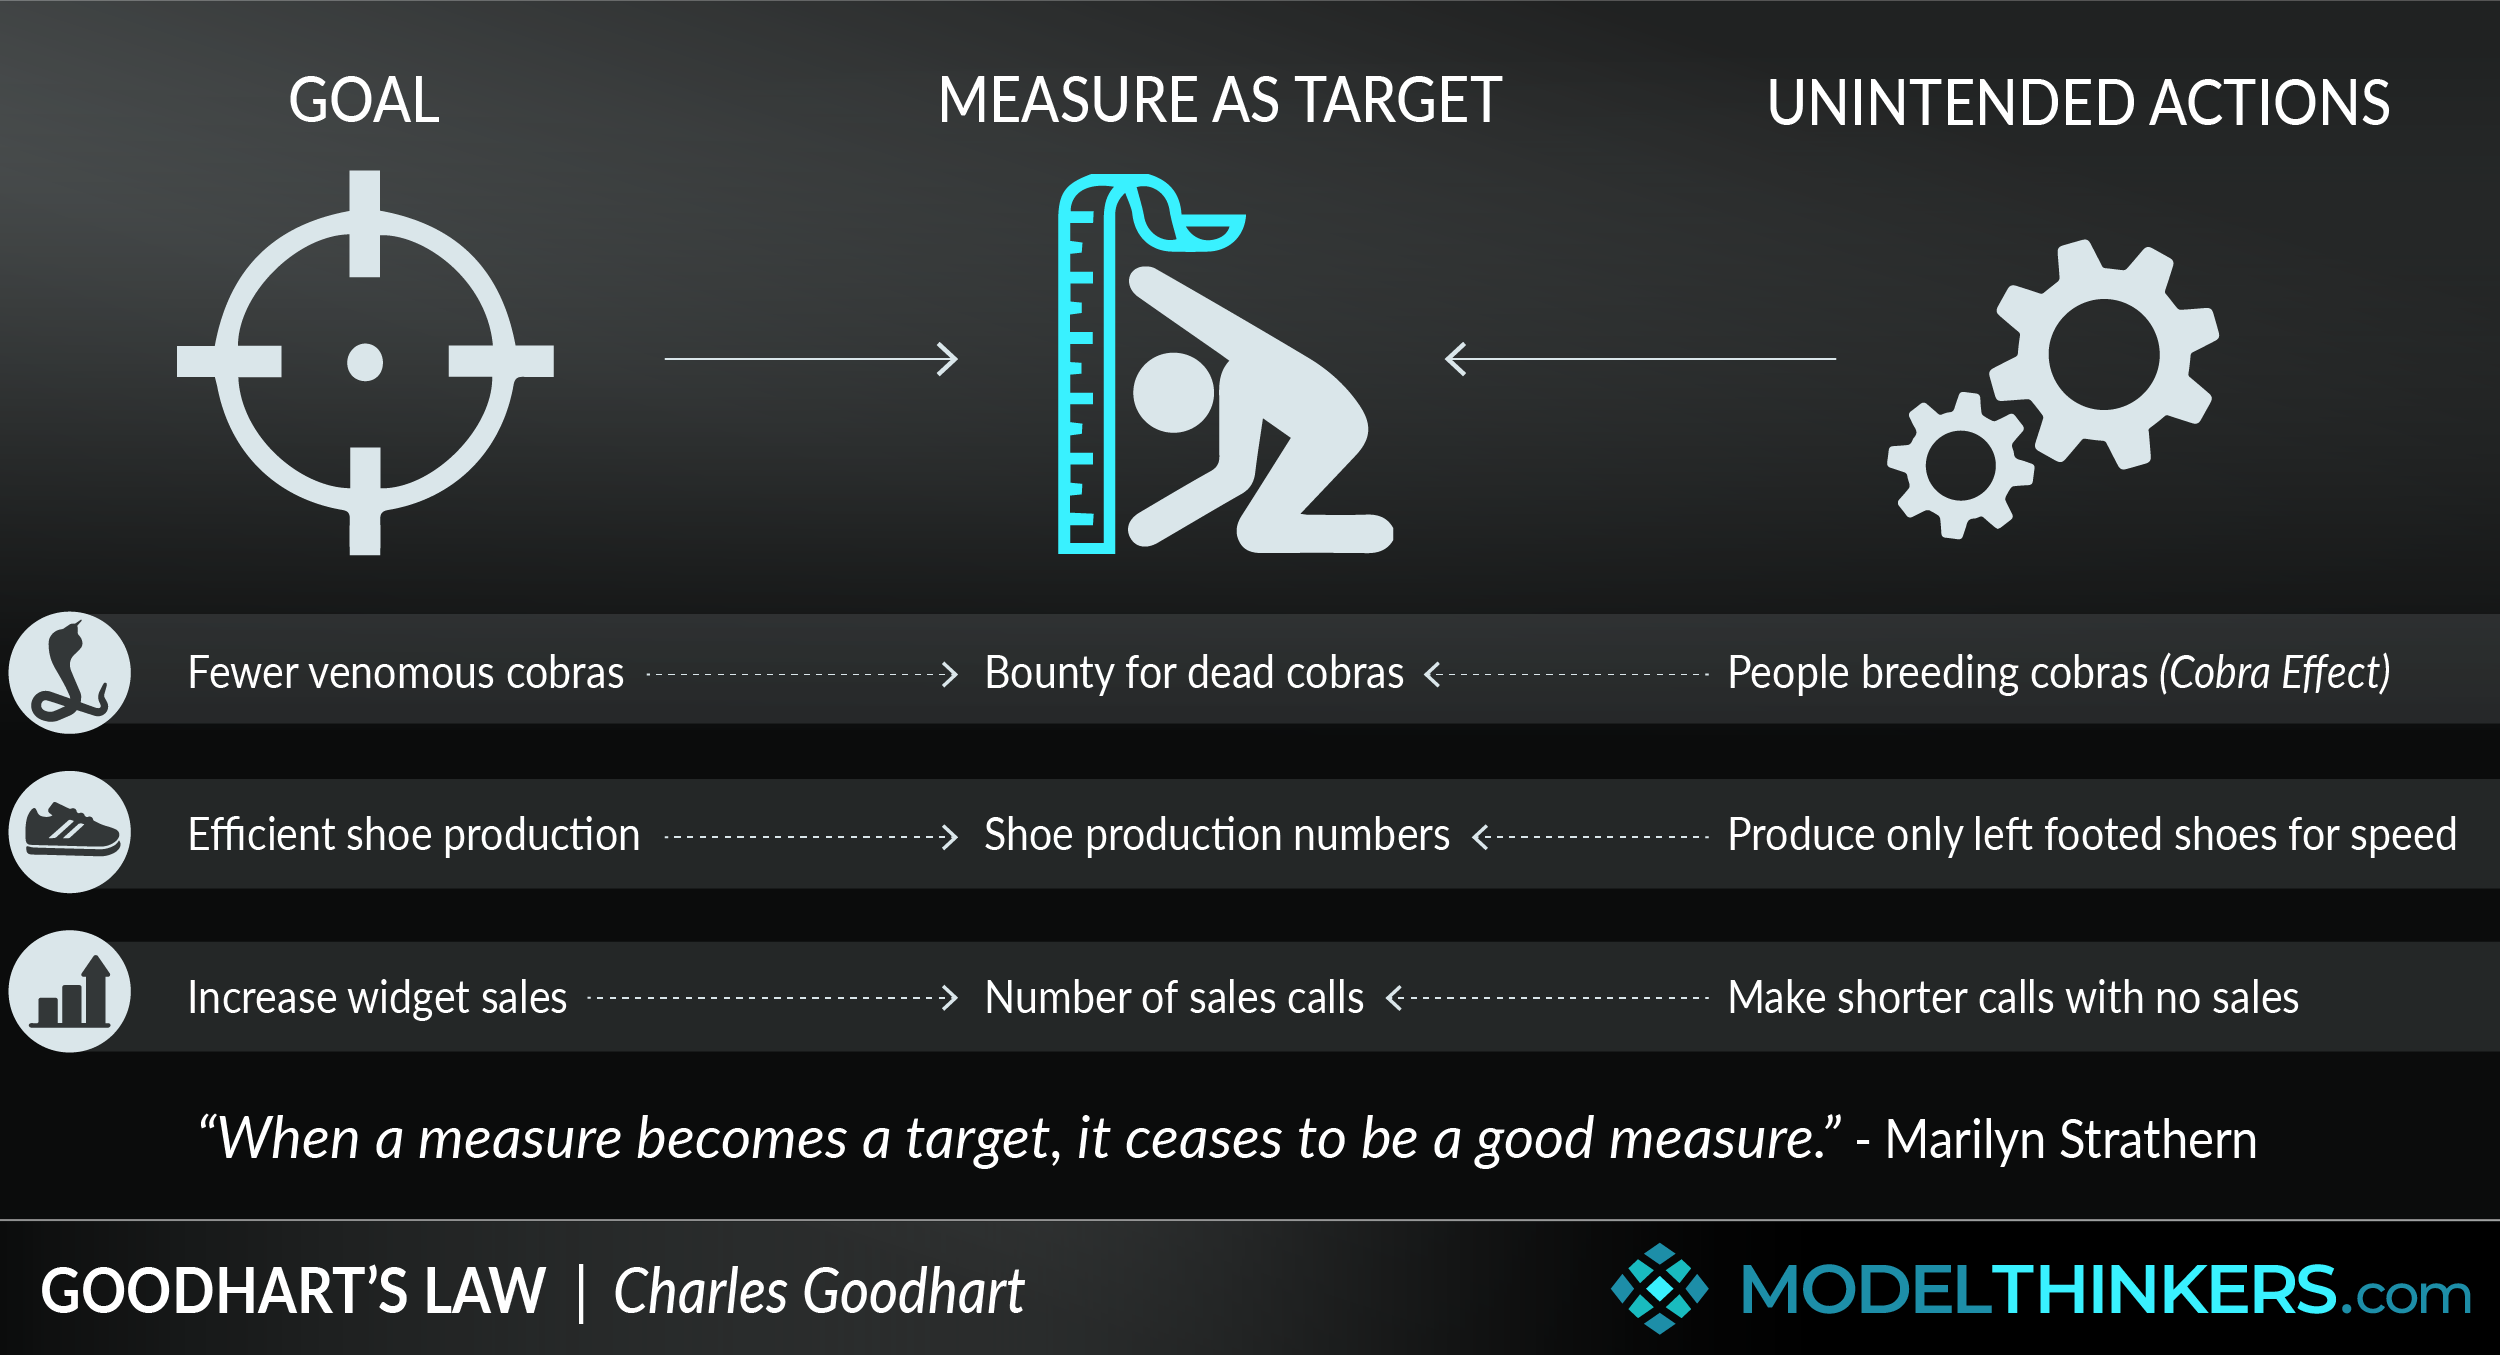
As you can see, focusing narrowly on a target can lead to behaviors that actively undermine the original goal. In product development, this is a frequent and dangerous trap.
2. From Theory to Practice: Metric Distortion in SaaS
How does this apply to a SaaS business? A common scenario is an intense focus on user acquisition. A team might be given an aggressive target to increase the number of new sign-ups, as this is seen as a proxy for growth.
To understand how this plays out, let's look at a more actionable version of Goodhart's Law, proposed by statistician Donald Wheeler. He stated that when people are pressured to meet a target, they have three options:
- Work to improve the system.
- Distort the system.
- Distort the data.
Options 2 and 3 are where the danger lies. A team might "distort the system" by running aggressive, heavily discounted marketing campaigns. This drives up sign-ups, but the new users may be low-intent customers who were only interested in the discount and are likely to churn quickly.
This is a classic example of optimizing a single metric (logo acquisition) at the expense of another (customer retention), which ultimately damages long-term value.
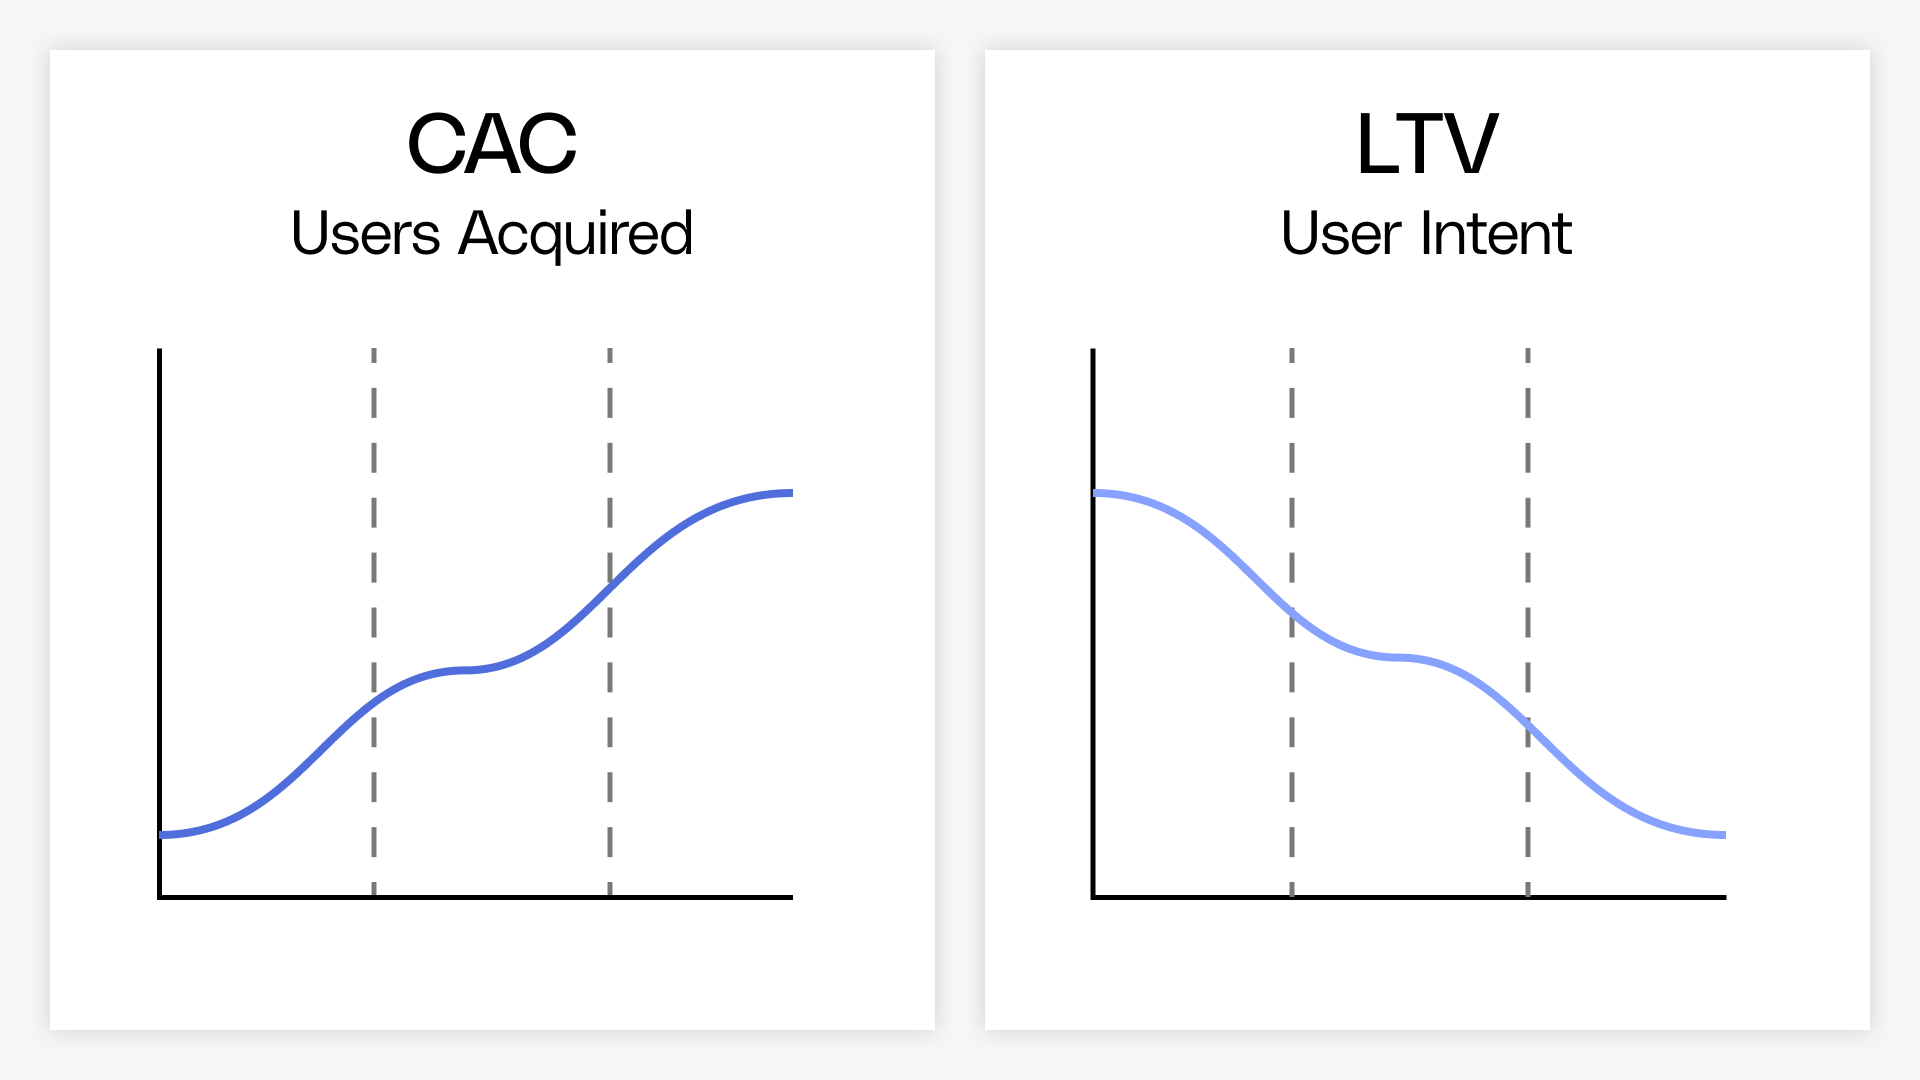
The following reading provides a sharp analysis of this very problem, including a powerful real-world anecdote from Amazon.
Goodhart's Law Isn't as Useful as You Might Think
The article 'Goodhart's Law Isn't as Useful as You Might Think' from Commoncog dives into how a world-class company like Amazon deals with this problem. It presents a fantastic case study on choosing the wrong metric and correcting course.
Please read the section titled 'How the WBR Accomplishes This'. Focus specifically on the anecdote about Amazon's retail teams. It starts with 'One mistake we made at Amazon...'. Notice how their initial metric, 'number of new detail pages', led to an increase in inventory costs rather than the desired increase in sales. This is a perfect example of a proxy metric failing. Pay close attention to how they evolved the metric over time to better reflect true customer value.
3. Your Turn: Modeling the Distortion
Now, let's make this real. You will take the financial model you built in the previous lesson and simulate a scenario where the team is pressured to hit an aggressive user acquisition target.
Scenario:
The leadership team loves your feature proposal but wants to reach the break-even point much faster. They set an aggressive target for the growth team: double the rate of new customer acquisition. To achieve this, the team launches a large-scale marketing campaign offering a steep introductory discount.
Instructions:
- Open your spreadsheet from the last lesson. Duplicate the sheet and name the new one "Distortion Scenario".
- In this new sheet, implement the following changes to model the consequences of this strategy:
- The "Optimization" (The Good News): Double the New Customers per Month. If you were using 50, change it to 100.
- The Consequence #1 (Higher Churn): The campaign attracts lower-quality, less-committed users. Double the Monthly Churn Rate. If you were using 3%, change it to 6%.
- The Consequence #2 (Higher Costs): The aggressive marketing campaign is expensive. Increase the Monthly Recurring Costs to account for the higher ad spend. Let's add $1,000 to this, so if it was $500, it's now $1,500 per month.
- Ensure all your formulas for MRR, Net Cash Flow, and Cumulative Cash Flow update with these new inputs.
- Analyze the Outcome: Compare the "Distortion Scenario" sheet with your original "Baseline" sheet. Find the answers to these questions:
- What is the new break-even month in the "Distortion Scenario"? Does it happen sooner or later than the baseline?
- Look at the Cumulative Cash Flow at the end of your 36-month timeline. Which scenario is more profitable in the long run?
Take about 20 minutes to adjust your model and analyze the results. This exercise is the heart of today's lesson, directly demonstrating the learning outcome.
4. Interpreting the Results & Finding a Solution
After completing the exercise, you likely found that while user numbers grew quickly, the higher churn and costs either delayed the break-even point or, more importantly, resulted in significantly lower long-term profitability. You successfully demonstrated how optimizing for a proxy metric hurt the system.
So, how do we prevent this? As a systems architect, your role is to design a system of metrics that resists this kind of distortion.
-
Use Metrics in Tension: Don't track just one thing. As the
ilulivideo suggested, you want to "reduce costs while maintaining quality." In our SaaS example, you should track New Users alongside Churn Rate, LTV, and CAC Payback Period. A dashboard that shows these metrics together forces a more holistic view. A drop in LTV or a spike in churn would immediately raise a red flag against the "good news" of higher user acquisition. -
Focus on Controllable Inputs that Drive Real Outcomes: As the Amazon story showed, the initial metric ("number of detail pages") was a poor input. They iterated until they found a metric that was a true driver of value ("Fast Track In Stock"). Your job is to constantly question if the chosen metrics are actually leading to the desired business outcomes.
-
Combine Quantitative with Qualitative: Metrics tell you what is happening, but they don't tell you why. Complement your dashboards with user research—a skill you are already proficient in. Talking to these new, high-churn users would quickly reveal they were never a good fit and were only attracted by a discount.
Conclusion
Today, you moved beyond simple financial modeling to explore the strategic risks inherent in using metrics. You've seen how a well-intentioned goal can lead to value-destroying behavior when the wrong metric is targeted.
Key Takeaways:
- Goodhart's Law is a critical concept for anyone designing or measuring systems. What you measure and incentivize dictates behavior.
- Optimizing for a single proxy metric (like user acquisition) without regard for its side effects (like increased churn and costs) can severely damage long-term profitability.
- As a systems architect, you can mitigate this risk by designing systems that use metrics in tension, focusing on true input drivers, and balancing quantitative data with qualitative insights.
Next Lesson Preview
You've now modeled both a baseline economic forecast and a scenario of metric distortion. In our next lesson, we will apply this thinking to the real world. You will analyze a case study where a company's focus on optimizing a key metric, such as user engagement, ultimately damaged its long-term business health, and you will map out the conflicting incentives that led to that outcome.