Hello! Welcome to Phase 2 of the Architect Track, where we shift our focus from system dynamics to Economic Modeling.
In the last module, you learned to analyze decisions in terms of their first and second-order consequences, seeing how a choice that looks good in the short term (like deploying a crude AI moderator to save costs) can trigger a long-term trust collapse. Today, we start to unpack the economic pressures that often drive those very first-order decisions.
Your learning outcome for this lesson is to model the cost structure of a SaaS feature in a spreadsheet, including build, infrastructure, and support costs.
As a systems architect and UX designer, understanding costs isn't just about accounting; it's a critical design tool. It allows you to evaluate trade-offs, propose solutions that are both innovative and viable, and communicate the business impact of your architectural decisions. Think of it like this: in mechanical engineering, you wouldn't design a part without considering the costs of R&D and tooling (build), the raw materials and energy to manufacture it (infrastructure), and the potential for warranty claims and maintenance (support). We will apply the same disciplined thinking to software.
1. The Three Pillars of Feature Cost
The total cost of any software feature can be broken down into three primary categories. Two are ongoing operating expenses (OpEx) that you pay every month, and one is an upfront investment, sometimes called a capital expenditure (CapEx).
- Build Cost (Upfront Investment): This is the one-time cost to research, design, develop, and launch the feature. It includes salaries for designers, engineers, and project managers involved in the initial creation.
- Infrastructure Cost (Ongoing OpEx): This is the recurring cost of the underlying technology that powers the feature. It includes server hosting, database usage, API calls, and data storage. This cost typically scales with user activity.
- Support Cost (Ongoing OpEx): This is the recurring cost of the people and tools required to maintain the feature and assist users. It includes a portion of salaries for customer support agents, success managers, and engineers fixing bugs. This cost typically scales with the number of users.
Let's begin with a reading that provides a formal framework for these cost categories within a SaaS financial model.
Build a SaaS Financial Model: Step-by-Step Guide
This article from K-38 Consulting, 'Build a SaaS Financial Model', gives a professional overview of how to forecast costs. It introduces the key terminology we'll be using.
Please read the section titled 'Creating Cost Forecasts'. Focus on its three subsections: 'Operating expenses breakdown', 'Headcount planning', and 'Infrastructure costs'. This will establish the foundational vocabulary for our model.
As the article highlights, "personnel-related expenses" (headcount) and "infrastructure costs" are the dominant forces in a SaaS budget. We can map these directly to our three pillars:
- Build Cost is primarily driven by the initial headcount for R&D.
- Support Cost is driven by the ongoing headcount for customer support, success, and engineering maintenance.
- Infrastructure Cost is driven by cloud hosting, data, and bandwidth fees.
The image below shows how these ongoing costs are often grouped in a financial report under "Average Cost of Service" (ACS).
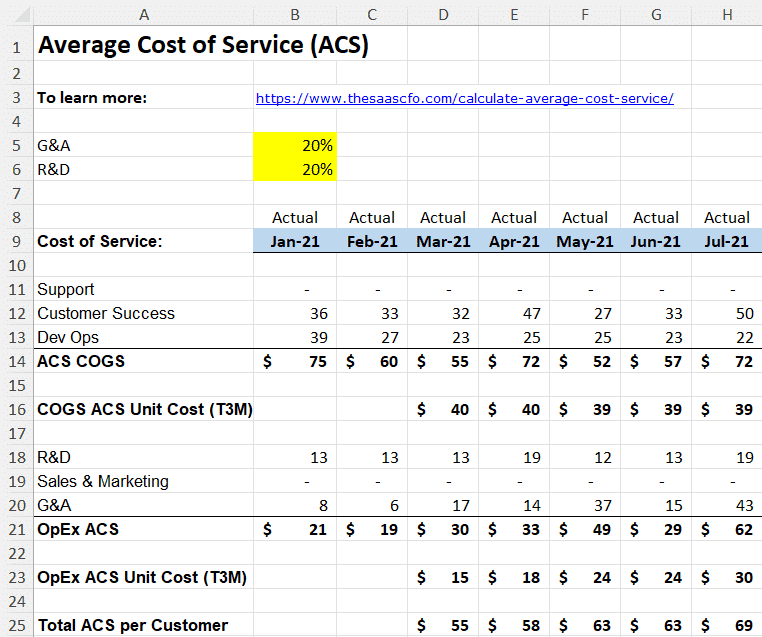
Here, "Support" and "Customer Success" clearly fall under our Support Cost pillar. "Dev Ops" (Development Operations) is a core part of the Infrastructure Cost. Notice that R&D (Research & Development) is also listed; in a real model, this gets tricky, as some R&D is for new features (Build Cost) while some is for maintaining old ones (Support Cost). For our purposes, we'll keep them distinct.
2. Modeling the Build Cost
The build cost is an upfront investment to bring a feature to life. The most practical way to estimate it is with a bottom-up approach: break the feature into its component tasks, estimate the hours for each, and multiply by a developer's hourly rate.
Your UX design background is an asset here. A well-defined feature spec with wireframes and user flows is the starting point for this estimation process.
The following reading provides an excellent, data-driven "menu" of what different software components cost to build.
SaaS Development Cost 2026: Real Pricing from 50+ Projects
Now let's get practical about 'Build Cost'. This article from UX Continuum, 'SaaS Development Cost 2026', gives real-world data on how long specific software features take to build.
Please read two key sections: 'Timeline Estimates by Feature Complexity': This is your 'menu' of common features and the hours required to build them. Notice how complexity (e.g., basic vs. advanced search) drastically changes the estimate. '2026 Developer Market Rates': This section helps you convert those estimated hours into a dollar cost. Don't try to memorize every number. The goal is to understand the method of breaking down a feature and associating effort with it.
To put this into practice, let's look at a template for this kind of estimation.
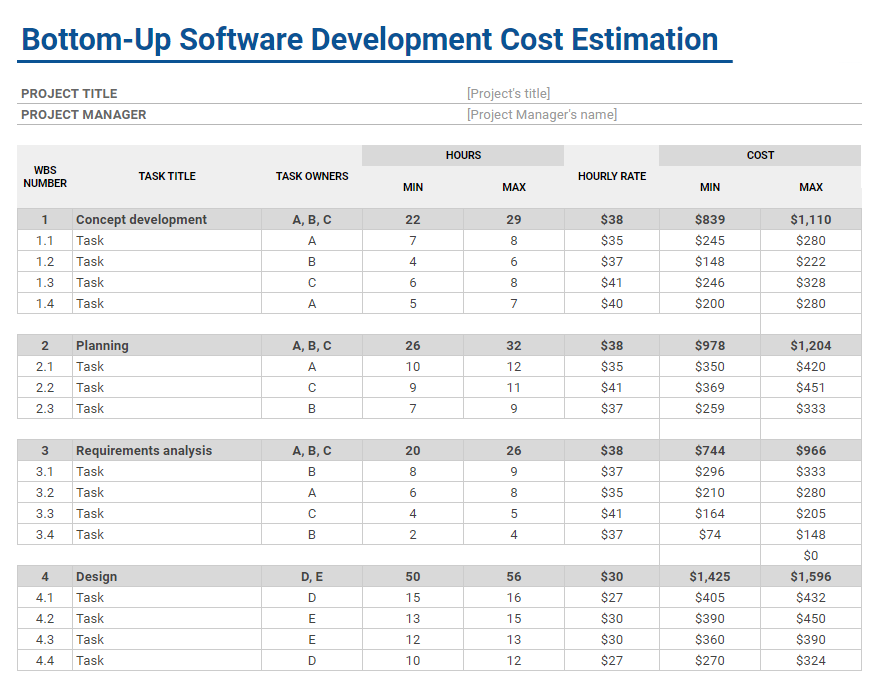
Mini-Exercise: Estimate a Feature's Build Cost
Let's estimate the build cost for a new feature: "A dashboard widget that shows a user's key performance metrics."
Using the resources:
- Breakdown (from the article):
Dashboard with charts/metrics: 16-24 hours
- Select Hourly Rate (from the article):
- Let's assume a Senior US remote developer:
$125/hour
- Let's assume a Senior US remote developer:
- Calculate:
- Average hours:
(16 + 24) / 2 = 20 hours - Base Cost:
20 hours * $125/hour = $2,500
- Average hours:
- Add Buffer (pro-tip from the article):
- The article suggests a 20-30% buffer for testing and project management. Let's use 25%.
- Buffer Cost:
$2,500 * 0.25 = $625 - Total Estimated Build Cost:
$2,500 + $625 = $3,125
This is a simplified but powerful method for turning a feature concept into a tangible budget number.
3. Modeling Infrastructure & Support Costs
Once the feature is built, you start paying to run and maintain it every month. These ongoing costs are critical to the feature's long-term profitability.
Infrastructure Cost
This is what you pay your cloud provider (like Amazon Web Services, Google Cloud, or Microsoft Azure). It's driven by usage.
- Hosting: The servers that run the code.
- Database: Storing the data the feature generates.
- Bandwidth: The data transferred to and from the user.
- Third-party APIs: Services your feature might rely on (e.g., a mapping service).
The UX Continuum article you just read has a great section on this. Under 'The Hidden Costs Most Founders Forget', the subsection '1. Hosting & Infrastructure' gives realistic monthly cost ranges based on the number of users. For an early-stage feature, this might be $50 - $200 per month.
Support Cost
This is the cost of human time spent on the feature after launch.
- Customer Support: Agents answering user questions about the feature.
- Engineering Maintenance: Developers fixing bugs or making small updates.
- Customer Success: Specialists helping customers get the most value out of the feature.
We can model this by estimating how many people are needed as the user base grows. Let's watch a short video that demonstrates exactly how to model headcount costs based on user numbers.
Subscription / SaaS Financial Model Tutorial
The video 'Subscription / SaaS Financial Model Tutorial' by Slidebean demonstrates how to scale team costs as a business grows. We'll focus on the part about customer support.
Watch the segment from 23:35 to 24:38. It explains how to model customer support costs by defining a ratio, for example, 'one support agent is needed for every 100 active customers'. This is a standard and effective way to forecast support costs.
Let's apply this logic. If a junior support agent costs $4,000/month (salary + benefits) and can support 1000 users, your support cost per user is $4/month. If your new feature is used by 500 customers, you'd allocate 500 * $4 = $2,000 in support costs, or more realistically, you'd assume those 500 users take up half of one support agent's time.
4. Your Turn: Build the Cost Model
Now, let's synthesize this into a simple spreadsheet model.
Scenario: You are proposing a new feature for your SaaS product: In-app notifications with a basic settings UI. You need to estimate its cost structure for the first month after launch, assuming it will be used by 1,000 customers.
Instructions:
- Open a spreadsheet program (like Google Sheets or Excel).
- Create the structure below.
- Fill in the
CalculationandCostcolumns using the resources from this lesson. Use your best judgment to pick reasonable numbers from the provided ranges.
| Cost Category | Item | Calculation | Cost (Month 1) |
|---|---|---|---|
| Build Cost (One-Time) | Feature Development | Estimate hours from LINK article for 'In-app notifications'. Multiply by a developer rate. Add a 25% buffer. | |
| Settings UI | Estimate hours from LINK article for 'Settings/configuration UI'. Multiply by the same rate. Add a 25% buffer. | ||
| Total Build Cost | Sum of the two items above. | ||
| Infrastructure (Monthly) | Hosting & Database | Use the low end of the 'Small Scale' estimate from LINK under 'Hosting & Infrastructure'. | |
| Third-Party Service (Email) | Notifications might trigger emails. Use the starting price for SendGrid from LINK under 'Third-Party Services'. | ||
| Total Infrastructure Cost | Sum of the two items above. | ||
| Support (Monthly) | Engineering Maintenance | Assume 5% of a senior developer's monthly time is for bug fixes on this feature. (Dev monthly cost = rate * 160 hours). | |
| Customer Support | Assume 1 support agent ($4k/mo) handles 2000 users. Calculate the cost for 1000 users. | ||
| Total Support Cost | Sum of the two items above. | ||
| TOTAL (Month 1) | Total Infrastructure Cost + Total Support Cost |
Take about 10-15 minutes to complete this. The goal isn't one "right" answer, but to practice the process of reasoned estimation.
Conclusion
Today you've translated a feature concept into a structured economic model. This is a foundational skill for making strategic design and product decisions.
Key Takeaways:
- The cost of a SaaS feature is composed of a one-time Build Cost and recurring Infrastructure and Support Costs.
- Build Cost can be estimated with a bottom-up approach: break the feature into tasks, estimate hours, and apply a developer rate.
- Infrastructure Costs are driven by cloud services and scale with usage.
- Support Costs are driven by headcount and scale with the number of customers and complexity.
- Modeling these costs in a simple spreadsheet provides a clear, defensible basis for evaluating the economic viability of a new feature.
Next Lesson Preview
Now that you have modeled the cost side of the equation, what about the other side? In our next lesson, we will focus on "Model the revenue projections for a SaaS feature based on user growth and pricing." By combining cost and revenue, we will be able to determine if a feature is not just useful for customers, but also valuable for the business.