Introduction
Hello! In our last two lessons, we explored two major threats to an AI system's integrity: model drift, where performance degrades naturally over time, and data poisoning, where a malicious actor intentionally corrupts the model. We learned that continuous monitoring for signals like performance degradation and output anomalies is our primary defense.
So, we know what to look for. But how do we make sense of all these signals? A stream of raw metrics is just noise. This is where your expertise as a UI/UX designer becomes critical.
In this lesson, we will address the learning outcome: Design a conceptual monitoring view for an AI Health Dashboard (e.g., drift, anomaly, data freshness metrics). We'll move from the abstract concept of monitoring to the practical design of an interface that allows a human operator to understand the health of an AI system at a glance. Think of it as designing a control panel for your AI, making its internal state visible, understandable, and trustworthy.
1. The Purpose of an AI Health Dashboard
An AI Health Dashboard is more than a set of charts for data scientists. It is a strategic tool for operational trust and governance. For product teams, operations managers, and support staff, it provides a single source of truth about whether an AI system is behaving as expected.
Academic and industry research highlights a shift towards creating these "operational trust dashboards" as a standard component of any production AI system. They are the control plane for human oversight.
[PDF] Architectural design for Human-Centered AI Systems
To understand the strategic importance of these dashboards, please read a short excerpt from the research paper 'Architectural design for Human-Centered AI Systems'. It describes the concept of a 'trust dashboard' and a future work section that perfectly outlines the components of an 'AI Health Dashboard'.
Please read the subsection 'Operational Trust Dashboards & Federated Oversight Platforms' (found under section 3.3.4). Then, read the first bullet point under the 'Future Work' section (Chapter 6). Focus on the core idea of an always-on 'control plane' and the key metrics proposed for the AI Health Dashboard.
As the paper outlines, an effective AI Health Dashboard needs to synthesize several key categories of metrics. For our purposes, we'll focus on three main pillars:
- Model & Data Health: Is the model's performance degrading? Is the input data it's seeing now different from the data it was trained on? This covers drift and anomaly metrics.
- Performance & Accuracy: Is the model still making correct predictions? This covers classic performance metrics like accuracy, error rates, and confidence levels.
- Data System Reliability: Is the data fueling the dashboard and the model up-to-date? This covers data freshness metrics.
Let's look at what these metrics mean and how we can visualize them.
2. Visualizing Key Health Metrics
Designing a dashboard requires translating complex statistical concepts into clear, scannable visuals. Your goal as the designer is to ensure a user can answer one question quickly: "Is everything okay?"
Visualizing Drift
In our lesson on model drift, we discussed that drift occurs when the statistical properties of data change over time. To monitor this, we don't need to be statisticians, but we do need to understand what the statistical tests tell us.
What Are Drifts and How to Detect Them? #machinelearning
The video 'What Are Drifts and How to Detect Them?' provides a brief, high-level explanation of some statistical tests used to detect drift. Watching this will give you the conceptual background to design for these metrics.
Please watch the segment from 06:42 to 08:15. This part covers statistical tests like the KS test and Population Stability Index (PSI). Focus not on the formulas, but on what they are used for: comparing distributions and generating a score that indicates the magnitude of change.
The key takeaway is that these tests produce a drift score. A low score means things are stable; a high score means something has changed significantly. This is perfect for a dashboard visualization. You can show the drift score on a time-series chart with a pre-defined "warning" or "critical" threshold.

This image also shows other important visualizations:
- Model Performance: Metrics like accuracy ("Model Quality"), error distribution, and a confusion matrix are shown. A sudden drop in quality or a change in the error pattern is a clear signal of a problem.
- Anomaly Detection (Implicit): In a real dashboard, you might have a dedicated chart for "Prediction Anomalies." This could track the percentage of predictions that are low-confidence or fall into a rare category. A sudden spike would be a major red flag for issues like the data poisoning attacks we discussed.
Visualizing Data Freshness
A dashboard is useless—or even dangerous—if the data it displays is stale. A user might react to an old problem that has already been resolved or, worse, miss a new one that hasn't loaded yet. Making the reliability of the data visible is a fundamental UX challenge.
From Data To Decisions: UX Strategies For Real-Time Dashboards
The Smashing Magazine article 'From Data To Decisions: UX Strategies For Real-Time Dashboards' is written for UX professionals and offers excellent, practical patterns for this challenge.
Please read the section 'Making Reliability Visible: Designing for Trust In Real-Time Data Interfaces'. Pay close attention to the concept of the 'Data Freshness Indicator' and the strategies for handling data lags and unavailability.
The "Data Freshness Indicator" is a brilliant, compact UI pattern. At a minimum, it should communicate:
- Status: Is the connection live, delayed, or offline?
- Last Update Time: A timestamp like "Data as of 10:42 AM".
- Control: A manual refresh button to give the user a sense of agency.
This transparency builds trust. The user knows not just what the data says, but how current that data is.
3. Your Turn: Design a Conceptual Dashboard View
Now, let's bring these concepts together. It's time to put on your designer hat and create a conceptual view for an AI Health Dashboard.
First, let's look at a high-level example. A dashboard might need to monitor multiple AI models at once. The main screen would need to show the status of each model, allowing a user to drill down for details.
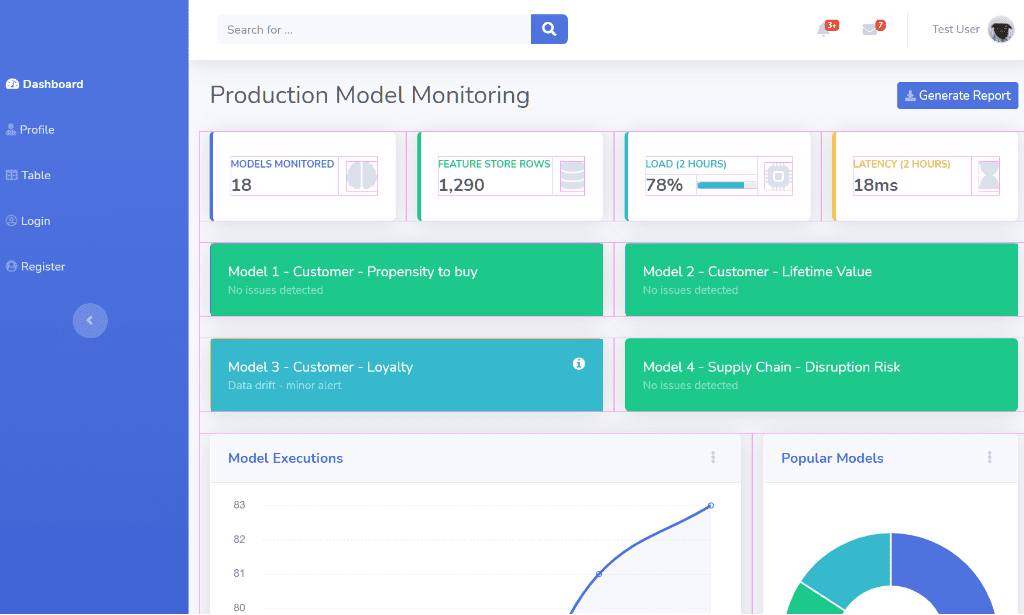
Your Task (15 minutes):
Let's return to the fintech scenario from our last lesson: a company has an AI model that helps freelancers categorize their bank transactions as "Personal" or "Business Expense."
Your task is to design a conceptual monitoring widget for this single "Expense Categorization AI." You don't need to design the whole page, just the one card or section dedicated to this model's health.
In your design (you can sketch it on paper, use a tool, or just describe it in text), address the following:
- Key Metrics: What are the 3-4 most important "at-a-glance" metrics you would display on this widget to convey its overall health? (e.g., Accuracy, Drift Score, etc.)
- Visual States: How would you visually represent the difference between a "Healthy" state and an "Alert" state? Think about color, icons, and text.
- Data Freshness: How would you integrate a "Data Freshness Indicator" into your widget design?
This exercise will help you translate the abstract monitoring requirements into a tangible UI concept that balances information density with clarity.
Conclusion
In this lesson, we've moved from identifying AI health signals to designing an interface to display them. We saw that an AI Health Dashboard is a crucial component for building operational trust in any AI-powered system.
Key Takeaways:
- An AI Health Dashboard is a user-facing control plane, not just a developer tool, that makes the AI's internal state transparent.
- Effective dashboards visualize key metric categories: model/data drift, performance/accuracy, and data freshness.
- Good dashboard design translates complex statistics into clear, actionable insights using visual hierarchy, purposeful color, and clear status indicators.
- Making data reliability visible through patterns like a Data Freshness Indicator is fundamental to building user trust in the system.
Next Steps
We've now designed a dashboard that can alert us when an AI model makes a bad decision. But an alert is just the beginning. The next logical question an operator will ask is, "Why did this happen, and who is responsible?"
In our final lesson of this module, we will tackle this by learning how to define an accountability chain for an AI-powered decision, from the model output back to the source data. This involves designing systems that not only flag errors but also provide a clear, auditable trail to understand their origin.