Introduction
Hello! In our last lesson, we focused on designing for known uncertainty. We explored how a UI can adapt its behavior—using hedging language, clarification loops, and escalation paths—when the AI signals that its confidence is low. This ensures the user is guided safely through moments of ambiguity.
But what happens when the system is confident, yet wrong? What if the model's accuracy, which was high when it was first deployed, is silently degrading over time? This subtle but critical failure mode is known as model drift.
This lesson addresses that very challenge. Our learning outcome is to explain model drift and identify user-facing signals that could indicate performance degradation.
We'll move from tackling known, telegraphed uncertainty to identifying the hidden erosion of a model's effectiveness. Understanding drift is essential for an architect of robust systems, as a system that isn't monitored for drift is fragile and destined to fail in ways that can damage user trust and business outcomes.
1. What is Model Drift?
At its core, model drift is the decay of an AI model's predictive power because the real-world environment has changed from the one it was trained on. A model is a static snapshot of the world at a particular point in time. When the world moves on, the snapshot becomes outdated.
Given your background in mechanical engineering, you can think of this as being analogous to material fatigue. A component might be designed and tested to withstand a specific set of initial loads. However, over time, repeated and changing real-world stresses (vibration, temperature cycles) can cause microscopic changes in the material's structure, leading to a gradual loss of strength and eventual failure, even if the component appears fine on the surface. Model drift is the informational equivalent of this process.
To get a clear and comprehensive definition of model drift, please watch the following video.
ML Drift: Identifying Issues Before You Have a Problem
This video from Fiddler AI, titled 'ML Drift,' provides an excellent introduction to the concept. It defines what drift is, why it's a significant business problem, and breaks it down into its different types.
Please watch from the beginning until 07:18. Focus on understanding the core definition of drift and the distinctions between the three main types: concept drift, label drift, and feature drift.
As the video explains, drift isn't just one thing. It manifests in several ways. Here’s a quick summary, illustrated by the diagram below.
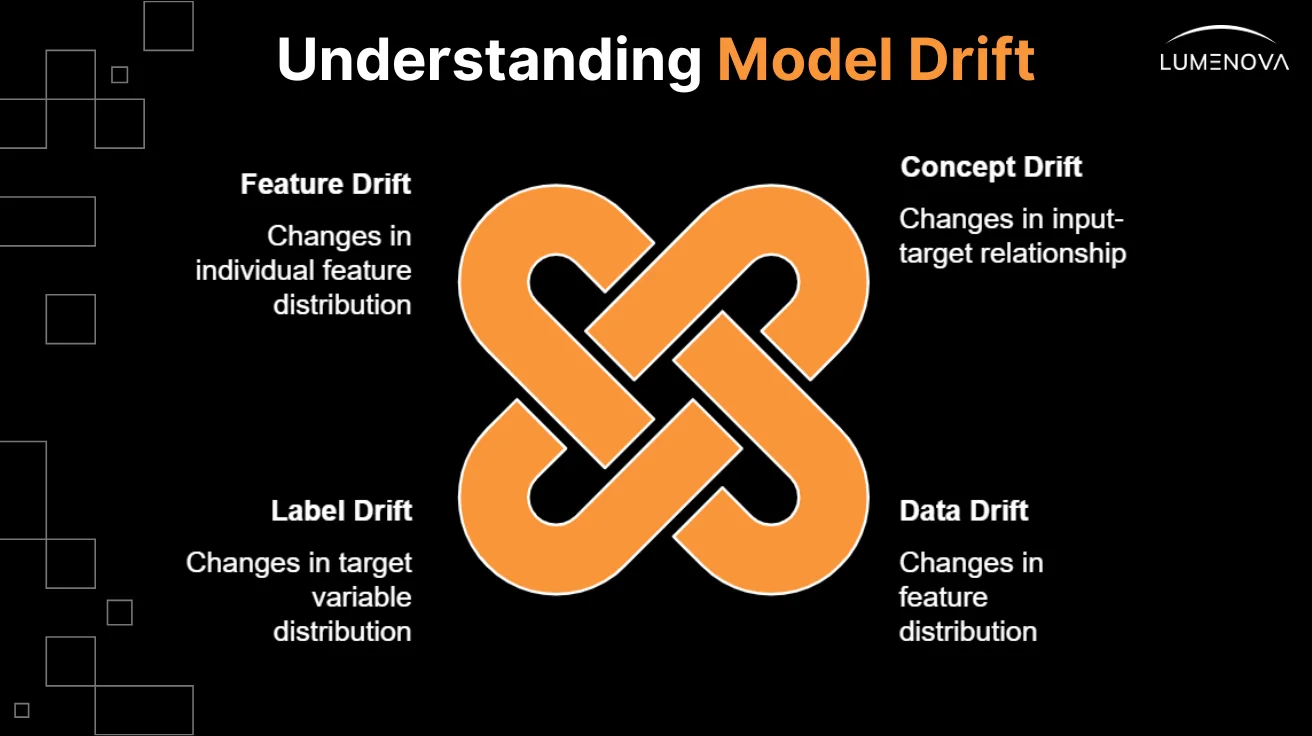
- Concept Drift: The relationship between inputs and outputs changes. The meaning of a concept shifts.
- Example: During an economic downturn, an income level that was once a predictor of low credit risk (
input) now predicts high credit risk (output). The underlying concept of "creditworthiness" has changed.
- Example: During an economic downturn, an income level that was once a predictor of low credit risk (
- Feature Drift (or Data Drift): The properties of the input data change.
- Example: A loan application model was trained on data from applicants who were mostly in their 30s and 40s. A new marketing campaign starts attracting applicants in their early 20s. The model now sees input features (like
age) that are statistically different from its training data, which may reduce its accuracy.
- Example: A loan application model was trained on data from applicants who were mostly in their 30s and 40s. A new marketing campaign starts attracting applicants in their early 20s. The model now sees input features (like
- Label Drift: The distribution of the output data (the "correct answers") changes.
- Example: A fraud detection system was trained when about 1% of transactions were fraudulent. Due to a new scam, the true rate of fraud suddenly jumps to 5%. The model, expecting a lower base rate, may start missing many of the new fraudulent cases.
2. Why Does Model Drift Happen?
Drift is not an "if," but a "when." It is a natural consequence of deploying a static model in a dynamic world. A great way to frame this from a UX and governance perspective is through the lens of "AI Identity Drift."
The whitepaper 'AI IDENTITY DRIFT' from Phase 5 frames this technical problem in a powerful, conceptual way. It argues that drift occurs when an AI 'forgets what it was built to do.'
Please read pages 3-8 (sections 'WHY AI IDENTITY DRIFT MATTERS' and 'Why AI Drifts — The Causes of AI Identity Failures'). Focus on the four structural causes it identifies: Data Contamination, Context Collapse, Silent Evolution, and Black-Box Evolution. These provide a non-technical yet deep understanding of why drift is inevitable.
As the resources highlight, the causes of drift can be grouped into two main categories:
-
Real-World Evolution (External Causes):
- Behavioral Shifts: Customer preferences, user habits, and societal trends change. (e.g., the pandemic shifting shopping from dress pants to yoga pants).
- Environmental Changes: Economic shifts, new regulations, or even seasonality can alter the patterns the model learned.
-
System & Data Issues (Internal Causes):
- Data Integrity Problems: A sensor breaks, an API changes its format, or a software bug starts feeding null values into a critical field. The video you watched mentions this as a common trigger.
- Silent Evolution: The model is retrained on new data without proper validation, slowly shifting its priorities in ways that were never intended. This is a key point from the AI IDENTITY DRIFT paper.
- Data Contamination / Context Collapse: The model is exposed to data from different contexts (e.g., another company's user base, another country's regulations) and incorrectly applies patterns from one context to another.
The critical takeaway is that drift can happen even when your system is technically "working." There are no server errors or crashes—just a silent, creeping decline in the quality and correctness of the AI's output.
3. Identifying User-Facing Signals of Degradation
Because drift is silent, you can't rely on traditional software monitoring (like uptime or server error rates) to catch it. You need a new set of signals, many of which are directly visible in the user experience or user behavior.
This is where your role as a UI/UX designer and systems architect is paramount. You need to know what to look for and how to design systems that make these signals visible.
AI observability: Why traditional monitoring isn't enough - Articles
The article 'AI observability: Why traditional monitoring isn't enough' clearly explains why AI systems require a different monitoring approach.
Please read the sections 'The unique monitoring challenges of AI systems,' 'Comprehensive AI monitoring frameworks,' and 'Semantic monitoring for AI quality.' Pay close attention to the concepts of output quality assessment and user feedback integration.
We can categorize these signals into two groups: those that come from user behavior and those that come from system metrics.
A. Indirect Signals (User Behavior)
These are changes in how users interact with your product. A degrading AI often leads to a frustrated user, and that frustration shows up in analytics.
- Increased Escalations: A rising number of users clicking the
[Talk to a human]button is a classic sign that the AI is no longer solving their problem. - Decreased Task Completion: If users are abandoning a workflow that involves the AI, it may be because the AI's suggestions are no longer helpful or relevant.
- Negative Feedback: An increase in "thumbs down" ratings, low star reviews, or negative comments explicitly mentioning the AI's quality.
- Corrective Actions: Users are more frequently editing, overriding, or ignoring the AI's output. For example, if an AI suggests a product description, and users are rewriting it from scratch more often, the model may have drifted.
B. Direct Signals (System Metrics)
These are metrics about the AI's output that can be tracked over time. While often used by internal teams, they can be surfaced in "AI Health Dashboards" that you might design.
- Trend in Output Quality Scores: You can use another AI (or a set of rules) to automatically score the primary AI's output for things like factualness, relevance, or helpfulness. A downward trend in this score is a direct measure of drift.
- Shift in Confidence Distribution: The model might not be producing wrong answers yet, but if the average confidence score for a specific task is slowly declining, it's an early warning sign that the model is becoming less certain.
- Increase in Output Anomalies: You can monitor for sudden changes in the AI's output patterns, such as:
- Response Length: The AI's answers suddenly become much longer or shorter.
- Topic Drift: A content summarization AI starts injecting unrelated topics into its summaries.
- Format Changes: An AI that's supposed to generate JSON starts producing malformed responses.

4. Your Turn: Designing a Drift Monitoring Component
Let's put this into practice. Your role is not to build the statistical models that detect drift, but to design the interfaces that make drift visible to the people who need to act on it—product managers, engineers, and business leaders.
Scenario: You are tasked with designing a component for an internal AI Health Dashboard. This dashboard monitors the "Portfolio Rebalancer" AI from our previous lessons.
Your Task:
Sketch or describe a UI component for this dashboard that would help the team detect model drift.
- Choose a Primary Metric: Select ONE key metric from the "Direct Signals" list above that you believe is most important for tracking the health of the Portfolio Rebalancer. Why did you choose it?
- Design the Visualization:
- How would you visualize this metric over time? (e.g., a line chart, a bar graph, a heatmap). Refer to the "Model decay" image as inspiration.
- How would you indicate a problem? (e.g., a threshold line, a change in color, an alert icon).
- Add a Secondary (User) Signal:
- Now, choose ONE signal from the "Indirect Signals" (user behavior) list.
- How would you display this alongside your primary metric to provide more context? For example, you could overlay "escalations to human advisor" on the same timeline as your primary metric.
- Explain the User Story: Briefly describe who this dashboard is for (e.g., a Product Manager) and what action they would take if they saw your component turn "red."
Take about 15 minutes to think through and outline your design. This exercise connects the abstract concept of drift to the concrete practice of UI/UX design for system oversight.
Conclusion
Today we explored model drift, the silent but inevitable degradation of an AI model's performance. We've moved beyond designing for known uncertainty and into the critical domain of monitoring for unknown, creeping failures.
Key Takeaways:
- Model drift is the decay of model accuracy as the real world changes, making the model's "knowledge" outdated.
- It is caused by shifts in concepts, input data (feature drift), or output distributions (label drift).
- Traditional monitoring is not enough. We must track user-facing signals, including changes in user behavior (indirect signals) and shifts in output quality (direct signals).
- As a systems architect and designer, your role is to make drift visible through tools like AI Health Dashboards, enabling teams to intervene before trust is eroded.
Next Steps
Drift is a natural, often unintentional process. But what happens when a model's performance is degraded on purpose? In our next lesson, we will explore an adversarial threat: data poisoning. We'll discuss what it is, how it can be used to manipulate an AI system, and how the monitoring principles we've learned today can be adapted to help detect such attacks.