Hello! Welcome back to our course on mastering product management.
In our previous two lessons, you learned how to decompose problems using the MECE principle and how to use a hypothesis-driven approach to focus your investigation. Today, we'll combine these skills into a single, powerful technique that is essential for any product manager: the issue tree.
When a senior leader asks, "Why has our user engagement dropped?" or "Why is our revenue flat this quarter?", a structured, logical answer is required. An issue tree, often called a metric tree in the product world, is a visual framework that allows you to systematically break down such a question and pinpoint the root cause. Mastering this technique is a direct response to the interview feedback you received and is a cornerstone of the strategic, end-to-end product thinking you're aiming to develop.
By the end of this 60-minute lesson, you will be able to apply the 'issue tree' technique to systematically break down why a product metric has changed.
1. The Issue Tree: A Map for Your Investigation
At its core, an issue tree is a visual way to apply the MECE principle. It starts with a main question (the "trunk") and breaks it down into smaller, more manageable sub-questions ("branches"). This prevents you from jumping to conclusions and ensures you explore all potential causes in a logical sequence. This technique is a staple in management consulting and a critical skill for product leaders.
To get a clear overview of the concept, let's watch a short video.
Learn Issue Trees for Case Interviews in 8 Minutes
This video from 'Hacking the Case Interview' provides a concise introduction to issue trees, explaining what they are, why they are important, and the basic steps to create one.
Watch from the beginning to 03:16. Focus on the definition of an issue tree and the four main ways to break down a problem: by stakeholder, process, segment, or math. This gives you a toolkit for creating your branches.
The key takeaway is that an issue tree provides a structured, comprehensive map for your analysis. Instead of randomly guessing causes, you lay out the entire landscape of possibilities in a MECE structure.
2. The Metric Tree: Applying the Issue Tree to Product
As a product manager, you'll most often apply this technique to diagnose changes in key performance indicators (KPIs). When an issue tree is focused on breaking down a top-level metric, it's called a metric tree. This moves the concept from a general problem-solving tool to an operational one for managing your product's performance.
A metric tree helps you understand the underlying drivers of your success and answer the crucial question: "What should we do next?"
Intro to Metrics tree - a powerful way to make metrics operational
This video, 'Intro to Metrics tree,' explains why simply looking at a dashboard of KPIs isn't enough. It introduces the metric tree as a way to connect metrics to actions and understand the root causes of change.
Watch from the beginning to 07:44. Pay very close attention to the distinction between 'component relationships' and 'influence relationships.' This is a critical concept for building an accurate and useful metric tree.
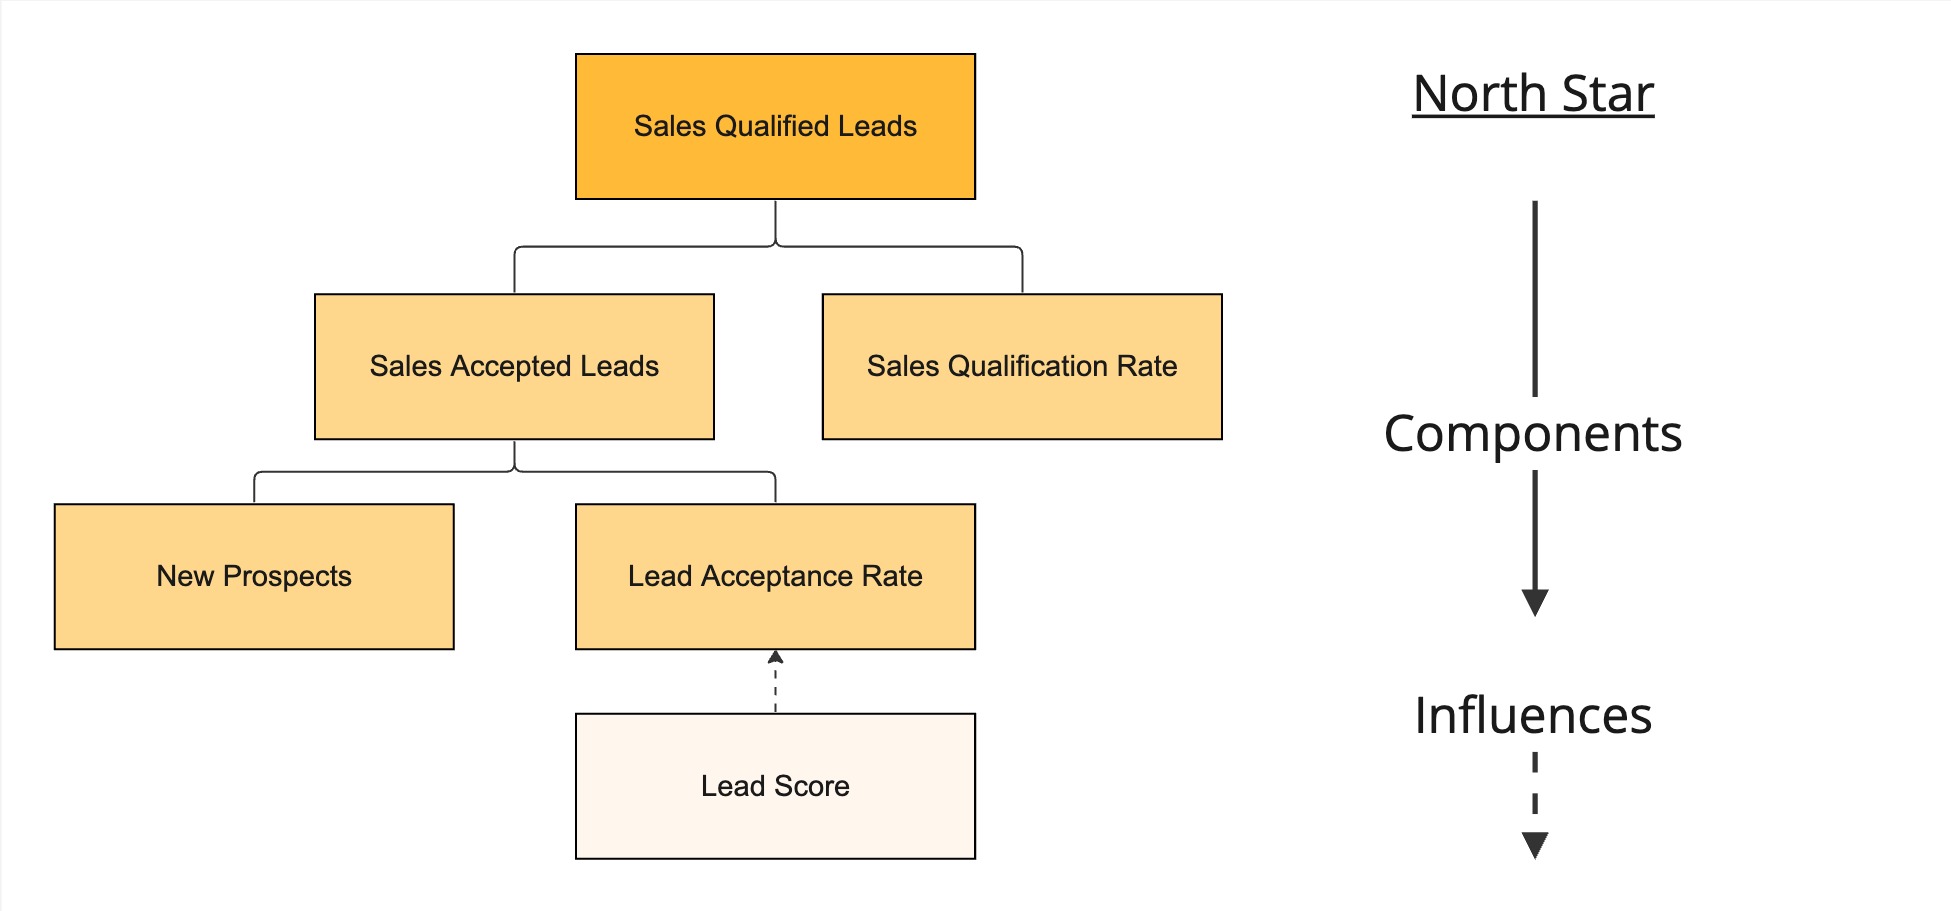
This video introduces two fundamental types of relationships in a metric tree:
- Component Relationships: These are direct, mathematical relationships. The sub-metrics literally add up or multiply to form the parent metric.
- Example:
Total Revenue = (Number of Active Users) × (Average Revenue Per User)
- Example:
- Influence Relationships: These are correlational, not strictly mathematical. A change in one metric is likely to cause a change in another, but it's not a formula.
- Example: Increasing
Website Speedis likely to improveConversion Rate, but you can't calculate the exact impact beforehand.
- Example: Increasing
Understanding this distinction is vital. Component relationships help you decompose the problem exhaustively, while influence relationships help you form hypotheses about which levers to pull.
Here is a simple visualization of these concepts in action.
3. How to Build a Metric Tree
Now let's walk through the steps of building a metric tree. We'll use a detailed guide and focus on an e-commerce example, which aligns with your interest in deepening your knowledge of this domain.
This article from Optiblack, 'Deep Dive: Metric Trees,' provides a fantastic, structured guide to building and using metric trees. We will focus on its clear definitions and the excellent e-commerce example.
Please read the following three sections from the article: 'Components of a Metric Tree': Focus on the hierarchy of a North Star metric and the L1, L2, L3 input metrics. 'Metric Relationships': Reinforce your understanding of Component vs. Influence relationships. 'Metric Trees of some Industries' > 'E-Comm': Study the image and text for the e-commerce metric tree. This provides a concrete example of how to break down a business model you're interested in.
Let's summarize the process based on the article and what we've learned so far:
- Start with the North Star Metric: This is your top-level metric that has changed. It's the "what" you're investigating (e.g., "Monthly Active Users," "Total Revenue").
- Decompose into L1 Metrics: Break down the North Star into its primary drivers. These are your first branches. A great way to start is with a mathematical component relationship.
- Decompose Further into L2/L3 Metrics: Break down each L1 metric into its own drivers. As you go deeper, you'll move from high-level output metrics to more granular input metrics that your team can directly influence.
When deciding how to break down a metric at each level, think back to the video on issue trees and the different types of breakdowns (math, segment, process). This handy image shows various MECE ways to structure your thinking.

4. Practice Exercise
Let's put this into practice. Imagine you're the Product Manager for an e-commerce fashion marketplace similar to ASOS or Zalando.
Scenario: Your North Star metric is Total Orders per Month. You notice this metric has declined by 10% over the last quarter. Your task is to build a metric tree to diagnose why.
Your Task:
- On a piece of paper or in a text editor, start your metric tree with "Total Orders per Month" at the top.
- Break down "Total Orders per Month" into its L1 component metrics. (Hint: Think about a simple formula for total orders. It involves the number of people who visit and how well you convert them).
- Choose one of your L1 metrics and break it down into at least two L2 metrics. These L2 metrics can be either components or influencers.
Take about 10 minutes to construct your tree before looking at the solution.
Click here to see a sample solution
Here's one possible way to structure the metric tree. Remember, there can be multiple valid structures.
North Star: Total Orders per Month
-
L1 Breakdown (Component Relationship):
A simple mathematical formula for total orders is:Total Orders = (Number of Unique Visitors) × (Overall Conversion Rate)So, the two L1 branches are:
- Number of Unique Visitors
- Overall Conversion Rate
-
L2 Breakdown (Focusing on "Overall Conversion Rate"):
Now, let's break down the conversion rate. We can decompose it by steps in the user funnel (a process-based breakdown).- L1 Branch: Overall Conversion Rate
- L2 Branch: Add-to-Cart Rate (% of visitors who add an item to their cart)
- L2 Branch: Checkout Start Rate (% of carts that start checkout)
- L2 Branch: Checkout Completion Rate (% of checkouts that are completed)
- L1 Branch: Overall Conversion Rate
-
L2 Breakdown (Focusing on "Number of Unique Visitors"):
Alternatively, we could break down where visitors are coming from (a segmentation breakdown).- L1 Branch: Number of Unique Visitors
- L2 Branch: Visitors from Paid Ads
- L2 Branch: Visitors from Organic Search
- L2 Branch: Visitors from Direct Traffic
- L2 Branch: Visitors from Social Media
- L1 Branch: Number of Unique Visitors
By building this tree, you've turned a vague problem ("Orders are down") into a specific set of hypotheses to investigate: "Is the problem that we're getting less traffic? Or is our traffic converting less effectively? If it's conversion, where in the funnel is the drop-off? The cart? The checkout?" This is the power of structured analysis.
Conclusion
Today, we've added a crucial tool to your structured thinking toolkit. The issue tree (or metric tree) provides a systematic, communicable, and exhaustive method for diagnosing complex problems. It allows you to move from observing a high-level outcome to identifying the specific, actionable inputs that are causing the change.
Key Takeaways:
- An issue tree is a visual, MECE framework for breaking down a complex problem into smaller, manageable parts.
- A metric tree is a product-specific application of an issue tree, used to diagnose why a key metric has changed.
- The relationships between metrics can be component (mathematical) or influence (correlational).
- Building a metric tree involves decomposing a North Star metric into hierarchical levels (L1, L2, L3) of input and output metrics, making the problem actionable.
Preview of the Next Lesson:
Analyzing a problem is only half the battle. The other half is communicating your findings and proposed solution clearly and persuasively. In our next lesson, we will focus on this communication piece. You'll learn the Situation-Complication-Resolution (SCR) framework, a classic storytelling structure used to present your analysis and recommendations in a way that is clear, concise, and compelling to any audience, from your team to senior executives.