Hello! Welcome to the sixth and penultimate lesson in our final module, Investor and Trader Discipline.
In our last lesson, we built the essential tool for self-improvement: the trading journal. You learned how to set one up and what to record for each trade, including your strategy, execution details, and, crucially, your emotional state. You now have a template to turn your trading activity into a rich dataset.
Today, we take the next logical step. Collecting data is only half the battle; the real value comes from analyzing it. Our learning outcome is to review a trading journal to identify recurring patterns in successful and unsuccessful trades. This process is what separates amateurs from professionals. It transforms your journal from a simple diary into a powerful analytical engine that will help you discover your unique trading edge and systematically eliminate costly mistakes.
From Data to Insight: The Power of the Review
A filled journal is like a logbook of your business's operations. The review process is the equivalent of a quarterly business review, where you analyze what's working, what's not, and why. This is where your interest in psychology and economics will be a great asset, as you'll be looking for behavioral patterns and statistical tendencies in your own decision-making under pressure.
The goal of the review is to answer critical questions like:
- Which of my strategies are actually profitable?
- Do I perform better at certain times of the day or week?
- How does my emotional state (e.g., fear, greed, confidence) correlate with my results?
- What are my most frequent and costly mistakes?
By answering these questions with data from your journal, you can make precise, evidence-based adjustments to your trading.
How to Use a Trading Journal to Improve Your Strategy
To understand the types of actionable insights we're looking for, read this section from the article 'How to Use a Trading Journal to Improve Your Strategy' on FX Replay. It gives concrete examples of patterns you can uncover.
Read the section titled 'Examples of Journal Improvements in Action'. Notice how the trader moves from raw data (e.g., win rate on Fridays) to a specific, strategic adjustment (e.g., cut late-day trades). This is the process we are learning today.
A Systematic Framework for Professional Self-Review
To avoid getting lost in the data, you need a structured review process. Professionals don't just glance at their P&L; they perform a deep, systematic audit of their performance and behavior. This process involves quantifying your performance and, most importantly, quantifying your mistakes.
Let's watch a video by professional trader Jason Graystone, who outlines a powerful method for this kind of self-review. His approach is rigorous and will give you a clear "how-to" guide.
How To JOURNAL TRADES Professionally
This first clip introduces the concepts of analyzing your performance in percentages and separating your trading results from your adherence to your plan. This is the foundation of an objective review.
Watch from 11:56 to 16:36. Pay close attention to the advice to focus on percentage returns rather than monetary P&L, and the importance of knowing your strategy's expected win rate and reward-to-risk ratio. This helps manage emotions and maintain perspective.
The "Fault" Analysis: Separating Process from Outcome
Now for the core of the review. The most critical task is to distinguish between good trades and bad trades based on your process, not the outcome. In our fourth lesson, we called this separating "Bad Breaks" from "Dumb Luck." The following method gives you a way to systematically measure this.
How To JOURNAL TRADES Professionally
This next clip is the heart of today's lesson. It details how to conduct a 'fault analysis' by identifying execution errors and quantifying how much money your mistakes are costing you (or making you, in the case of luck).
Watch carefully from 16:36 to 23:28. Focus on understanding the three main sources of error and how to tally them:
Let's summarize the key concepts from the video:
- Excessive Loss: Go through your losing trades. Did any of them lose more than your pre-defined maximum risk (e.g., your 1R stop-loss)? The extra amount lost is an error.
- Execution Error (Invalid Trades): Review every trade against your trading plan's checklist. Was the entry valid? If you took an invalid trade, the entire P&L (whether a win or a loss) is attributed to an error. A profitable but invalid trade is a "Gained from my fault" trade—it's bad practice that got lucky.
- Missed Entries: Review your charts for the period. Did any valid setups occur that you failed to take? The potential profit you missed is also a result of error (in this case, hesitation or lack of attention).
By doing this, you create two running tallies:
- Lost from my fault: The total amount of money lost due to your own mistakes.
- Gained from my fault: The total amount of money gained from breaking your rules.
Quantifying Your Discipline: The Performance Discrepancy
Once you have these tallies, you can calculate a score for your own discipline. This turns the subjective feeling of "I traded well this week" into a hard number.
How To JOURNAL TRADES Professionally
This final clip from Jason Graystone shows how to use your 'fault' tallies to calculate two key metrics that measure the impact of your human error on your overall performance.
Watch from 23:28 to 25:56. Understand the difference between 'Net Performance Discrepancy' and 'Gross Performance Discrepancy'.
- Net Performance Discrepancy: This shows the net impact of your errors. It's calculated as
(Gained from my fault) - (Lost from my fault). A negative number means your mistakes cost you money, while a positive number means you got lucky. - Gross Performance Discrepancy: This shows the total magnitude of your errors. It's the sum of the absolute values of all your faults. This number reveals how disciplined you were, regardless of whether your mistakes helped or hurt you.
Your goal as a trader is to get your Gross Performance Discrepancy as close to zero as possible. This signifies flawless execution of your trading plan.
Tools for Analysis: Making the Review Efficient
Conducting this review can be done with a simple spreadsheet, but it requires manual calculations.
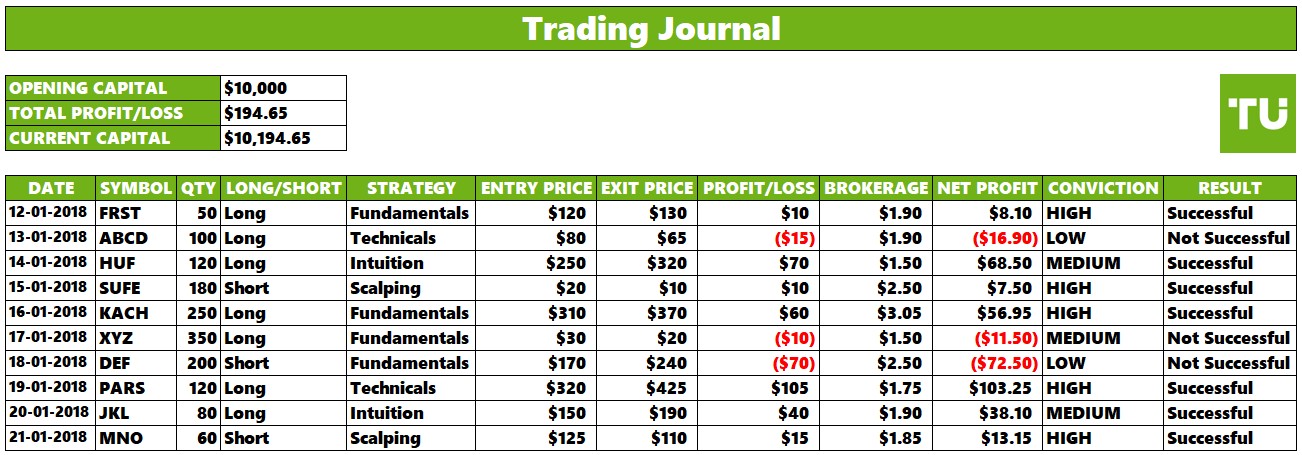
However, dedicated journaling software can automate this entire process, providing instant insights and visualizations. These tools are designed for pattern recognition.

Let's see how this automation works in practice with Edgewonk, a popular journaling tool.
Full Edgewonk Trading Journal Tour - All Features
This clip demonstrates how journaling software allows you to instantly filter and analyze your trades by different criteria, such as the setup or strategy used.
Watch from 17:24 to 19:12. See how the software breaks down performance for each trading setup (e.g., 'breakout'). This immediately tells you which strategies are your winners and which are your losers.
The tags you created in the last lesson (e.g., #fomo, #revenge_trade) are incredibly powerful when paired with analytical tools.
Full Edgewonk Trading Journal Tour - All Features
Now, see how tracking your behavior and emotions pays off. This clip shows how software can analyze the comments and tags you assign to each trade.
Watch from 39:30 to 40:30. Notice how the software aggregates all trades tagged with 'Revenge trading' to show you the exact financial cost of that specific emotional mistake. This makes the consequences of your psychological patterns undeniable.
Test your understanding!
You've reviewed your last 30 trades. Your journal analysis reveals the following:
- Your "Breakout" strategy has a win rate of 70% and an average profit of 1.8R per trade.
- Your "Mean Reversion" strategy has a win rate of 40% and an average loss of 1.2R per trade.
- Your Gross Performance Discrepancy is 8%, and the biggest contributor to your "Lost from my fault" tally is widening your stop-loss on losing "Mean Reversion" trades.
Based on this data, what are two specific, actionable changes you could make to improve your trading?
Show answer
- Focus on your edge: Trade the "Breakout" strategy more frequently, and either stop trading the "Mean Reversion" strategy or go back to testing it to see if it can be improved. The data clearly shows one is working for you and the other is not.
- Fix your biggest leak: Create a hard-and-fast rule: "I will never widen my initial stop-loss after entering a trade." Since this is your biggest source of "fault," eliminating this single behavior would significantly improve your discipline and profitability.
Conclusion
You are now equipped with a professional-grade methodology for reviewing your trading journal. This isn't just about looking at your wins and losses; it's about a deep, honest audit of your performance to find your strengths, diagnose your weaknesses, and measure your discipline.
Key Takeaways:
- Regularly review your journal (weekly is a good starting point) to turn data into actionable insights.
- The goal is to identify recurring patterns in your strategies, timing, and behavior.
- Use the "Fault Analysis" method to distinguish between process errors and outcomes, and to quantify your mistakes in a "Lost from my fault" and "Gained from my fault" tally.
- Calculate your Gross Performance Discrepancy to get an objective measure of your discipline. Your goal is to get this number to zero.
- Use your findings to make specific, data-driven adjustments to your trading rules.
A Look Ahead:
This lesson has been about finding the patterns. Our final lesson in this course, Develop a personalized trading plan that defines rules for entry, exit, and risk management, is about codifying those findings. The insights you gain from your journal review are the very foundation upon which you will build your personal trading plan—a set of rules designed to maximize your strengths and protect you from your weaknesses.