Hello! Welcome to your fifth lesson in the "Setting Up Your Investment Hub" module.
In our last session, we took a tour of a typical brokerage platform. You learned how to navigate the dashboard to find your account balance, view your holdings, and search for specific stocks. Essentially, you learned where to find the information.
Today, we'll focus on what that information means. The learning outcome for this lesson is to read a stock quote to identify the current price, day's range, and volume. A stock quote is a snapshot of a stock's trading activity, and understanding its components is fundamental to making any investment decision. Think of it as learning to read the vital signs of a company's stock before you decide to act.
This knowledge is the direct prerequisite for our next module, where you'll start executing your first trades.
What is a Stock Quote?
When you look up a stock on your brokerage platform or a financial website like Yahoo Finance, the first thing you see is its stock quote. This is a collection of real-time data that tells you what's happening with the stock right now.
Let's start with a quick video that provides an excellent overview of a standard stock quote.
🔴 How To Read A Stock Quote ❗ Stock Market For Beginners🔴
The video 'How To Read A Stock Quote' by The Monk Way offers a concise tour of the main components. It will quickly familiarize you with the most prominent data points.
Please watch the segment from 00:13 to 00:59. As you watch, pay attention to these key terms: Current Price: The price at which the stock last traded. Ticker Symbol: The unique identifier for the stock (e.g., AAPL for Apple). Daily Change: How much the price has moved up or down today, shown in both dollars and percentage.
As the video shows, the most prominent piece of information is the current price. This is the price you would pay if you were to buy one share at this very moment (or the price you would receive if you sold). It's constantly changing during market hours as buyers and sellers trade shares.
Understanding Price Movement: The Day's Range
A stock's price doesn't stay static. It fluctuates throughout the trading day based on supply and demand. To understand this movement, we look at the day's range.
The day's range tells you the highest and lowest prices the stock has traded at so far during the day. It gives you a sense of the stock's volatility on that particular day.
To get a more formal definition of these terms, let's turn to a resource from the brokerage firm Charles Schwab.
More Than Meets the Eye: How to Read Stock Quotes
The article 'More Than Meets the Eye: How to Read Stock Quotes' clearly defines the key metrics related to daily price movement.
Please read the section titled 'Dynamics of stock price movement: Technical factors'. Focus on the definitions for: Today's open: The first price of the day. Today's range: The high and low prices for the current day. 52-week range: The high and low prices over the past year.
So, to recap:
- Open: The price of the first trade when the market opened.
- Low: The lowest price the stock hit during the day.
- High: The highest price the stock hit during the day.
- The Day's Range is simply the difference between the day's High and Low.
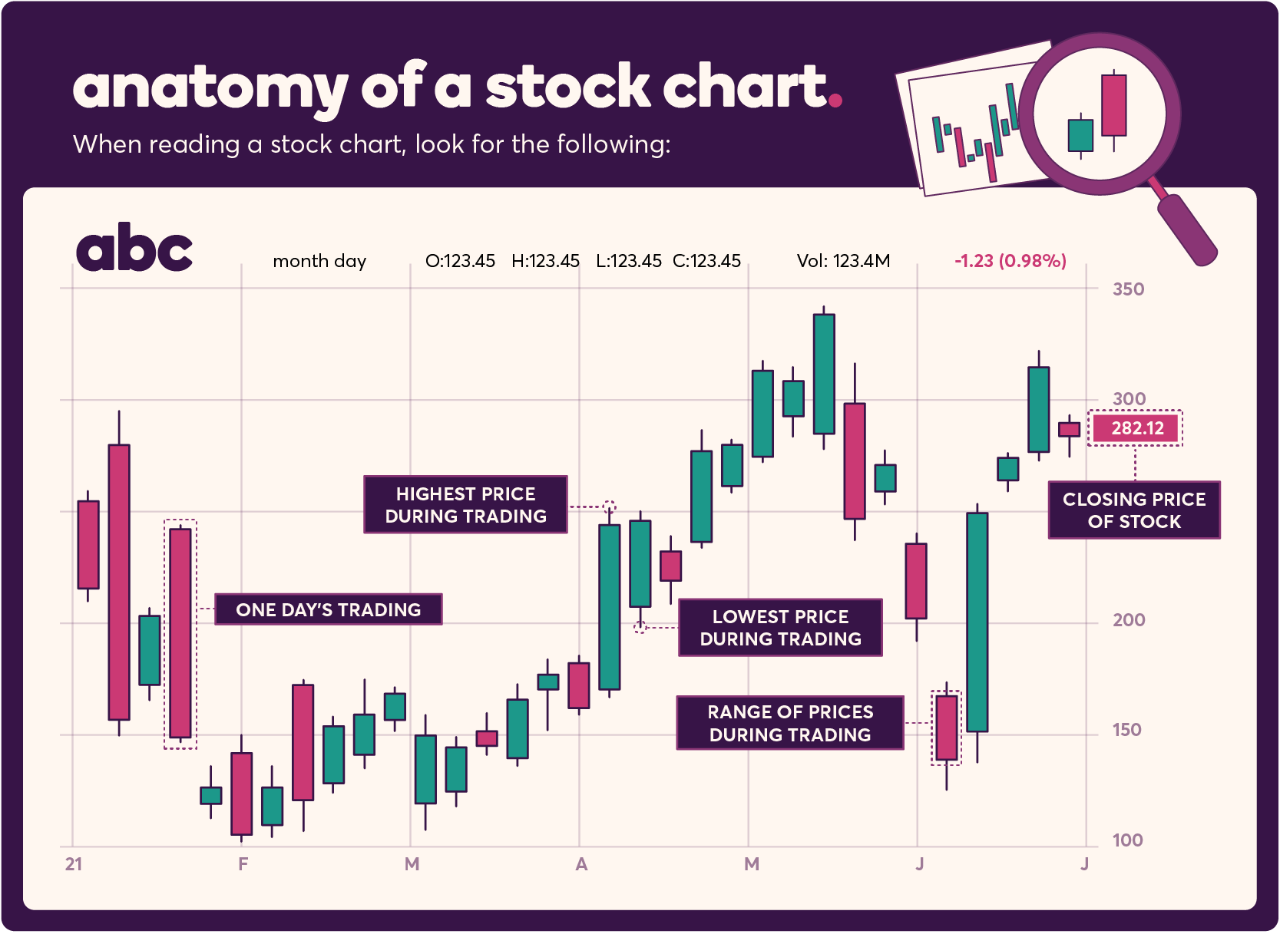
This can be visualized clearly on a stock chart. The image below shows how the open, high, low, and close prices form a "candlestick" for a single day, and the range is the distance between the highest and lowest points.
Test your understanding!
You are looking at a stock quote for Company XYZ. The Day's Range is listed as $150.25 - $155.60. The current price is $155.10.
Could you have purchased shares for $150.00 earlier today?
Show answer
No. The lowest price the stock traded at today was $150.25, as indicated by the low end of the Day's Range. You could not have bought it for any price below that.
Gauging Market Interest: Trading Volume
The final key piece of the stock quote we'll cover today is volume.
Volume is the total number of shares of a stock that have been traded during a given period, usually the current day.
Volume is a crucial indicator because it tells you how much interest there is in a stock. A high volume means many shares are being bought and sold, which indicates a lot of activity and interest. This is important for a very practical reason: liquidity.
A liquid stock is one that you can buy or sell easily without causing a major price change. High-volume stocks are generally very liquid. Conversely, a stock with very low volume can be illiquid, meaning it might be difficult to sell your shares when you want to because there aren't enough buyers. This is a concept that appeals to the practical, "how-to" approach you prefer—it directly impacts your ability to execute your strategy.
Let's watch a video that explains this concept very clearly.
How to Read Stocks for Dummies Tutorial - Investing 101
The video 'How to Read Stocks for Dummies Tutorial' from ClearValue Tax does an excellent job of explaining not just what volume is, but why it's important for an investor.
Please watch the segment from 04:41 to 06:40. Focus on the explanation of what volume represents and the concept of 'liquidity'—the ease of buying and selling shares.
As the video explains, seeing a high volume gives you confidence that you can easily enter or exit a position. Most quotes will also show the average volume (usually over the last 3 months), which helps you see if today's trading activity is unusually high or low compared to the norm.
Test your understanding!
You are considering two stocks for a short-term trade.
- Stock A has a daily volume of 50,000,000 shares.
- Stock B has a daily volume of 5,000 shares.
Which stock would be easier to sell quickly if you needed to? Why?
Show answer
Stock A would be much easier to sell. Its extremely high volume indicates high liquidity, meaning there are many buyers and sellers actively trading the stock. You could likely sell your shares almost instantly at the current market price. Stock B, with its very low volume, is illiquid, and you might struggle to find a buyer right away.
Conclusion
Congratulations on completing this lesson! You can now dissect a basic stock quote and understand what the numbers are telling you about a stock's price and trading activity.
Here are the key takeaways:
- A stock quote is a real-time summary of a stock's trading data.
- The current price is the most recent price at which the stock was traded.
- The day's range (composed of the daily high and low) shows the stock's price volatility for that day.
- Volume measures the number of shares traded and is a key indicator of market interest and liquidity.
In our next lesson, we will begin the "Executing Your First Trades" module. You'll learn to distinguish between market orders, limit orders, and stop-loss orders. Now that you know how to read the current price, you'll be ready to learn how to use that information to tell your broker exactly how you want to buy or sell a stock.