Hello! Welcome to your fourth lesson in the "Setting Up Your Investment Hub" module.
In our last session, we walked through the practical steps of opening and funding your first brokerage account. Now that you have this central hub, it's time to get comfortable using it. Think of it like getting the keys to a new car; the next step is to learn what all the buttons and dials on the dashboard do.
Today's learning outcome is to navigate a typical brokerage platform interface to view holdings, account balance, and find stock information. We'll explore the main sections you'll interact with on any brokerage platform. While the visual design will vary from one broker to the next, the core functions and information are universal.
Mastering this will empower you to monitor your investments and research new opportunities with confidence.
The Anatomy of a Brokerage Dashboard
When you log into your brokerage account, you'll land on a main screen or "dashboard." This is your command center. It's designed to give you a high-level overview of your financial situation at a glance.
Generally, you will always find these key pieces of information:
- Total Account Value: The total worth of all cash and investments in your account.
- Performance Chart: A graph showing how your account value has changed over time (e.g., today, this week, this year).
- Buying Power: The amount of cash you have available to purchase new investments.
- Holdings/Positions: A list of the specific stocks and funds you currently own.
Here is an example from the Charles Schwab platform, a traditional brokerage firm. Notice how it presents the total value, a performance graph, and a list of accounts.

A Guided Tour of a Brokerage Platform
To bring this to life, we'll watch a walkthrough of the Robinhood mobile app. Robinhood's simple interface makes it excellent for learning the fundamentals. Pay attention to how the concepts we just discussed are presented.
Robinhood Investing Tutorial 2025
The video 'Robinhood Investing Tutorial 2025' by Dalton Litz provides a clear tour of a brokerage home screen. We'll focus on the core components like account value, buying power, and the list of investments.
Please watch the segment from 03:18 to 06:20. As you watch, identify the location of: The overall account value. The portfolio performance chart (and how to change its time frame). The 'Buying Power'. The list of stocks and ETFs the user owns (their 'holdings' or 'positions').
As you can see, the main screen immediately answers the most important questions:
- How much is my account worth? (Total Value)
- How is it performing? (Performance Chart)
- What do I own? (Holdings/Positions list)
- How much can I spend? (Buying Power)
Different platforms organize this slightly differently. For example, in the Fidelity app, these pieces of information are found under the "Accounts" tab, with sub-sections for "Summary," "Positions," and "Balances." The principle remains the same.
Test your understanding!
You have just sold a stock and received $500 in cash. You want to know if you can immediately use that money to buy shares of a different company. Which piece of information on your dashboard would you check to confirm this?
Show answer
You would check your Buying Power. This figure represents the total cash settled and available for you to use for new purchases.
Finding and Researching a Specific Stock
Your brokerage platform isn't just for viewing what you own; it's also your primary tool for researching new potential investments. Every platform has a search function where you can look up a company by its name or its stock ticker symbol.
Once you search for a stock, you'll be taken to its "profile page," which is packed with useful information. Let's explore what a typical stock profile page looks like.
Robinhood Investing Tutorial 2025
Let's return to the 'Robinhood Investing Tutorial 2025' video. The presenter does an excellent job breaking down the information page for both an ETF (VOO) and an individual stock (Tesla).
Watch the segment from 27:39 to 31:49. Focus on the key data points provided for a stock, such as: The price chart. Key statistics (like the 52-week high/low, volume). Company news. Analyst ratings and research reports.
This part of the platform is where you'll spend a lot of your time as an investor. You can analyze a stock's historical performance, read up on recent news affecting the company, and find key financial data.
Here's another example from the Interactive Brokers platform. You can see it presents the same types of information: a chart, quote details, your current position, and company statistics.
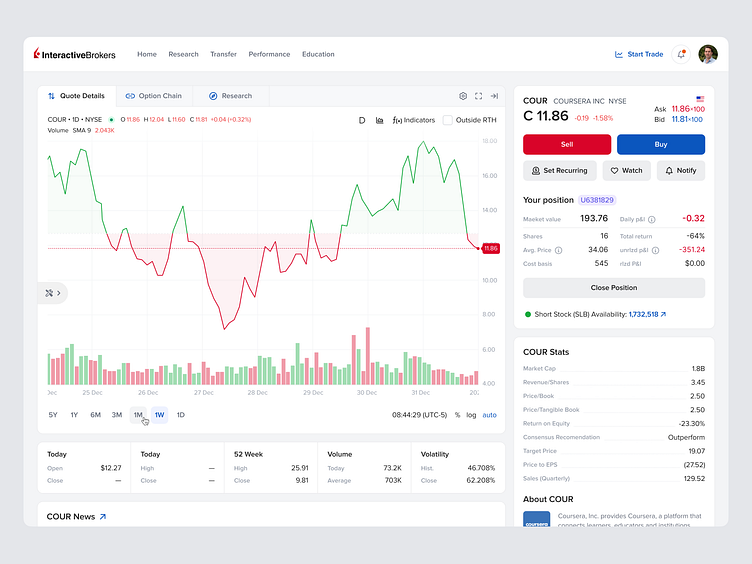
Keeping an Eye on Stocks with Watchlists
What if you're interested in a company but aren't ready to invest? You can use a watchlist. A watchlist is simply a list of stocks you want to track. It's a powerful tool for monitoring potential investments without cluttering your main portfolio view. Your interest in philosophy might lead you to appreciate this function—it allows for patient observation before committing to action.
Let's see how to create and manage a watchlist on the Fidelity platform.
Fidelity Mobile App Tutorial for Beginners
The 'Fidelity Mobile App Tutorial for Beginners' by shortthestrike provides a great demonstration of how to create, customize, and add stocks to a watchlist.
Watch the section from 03:01 to 06:11. Observe how you can create a new list, give it a custom name, add stock symbols to it, and switch between different watchlists you've created.
Using watchlists is a great habit to build. You can create different lists for different purposes, such as "Tech Stocks I'm Watching," "Potential Dividend Investments," or "Companies to Research Further."
Conclusion
You've now taken a comprehensive tour of a typical brokerage platform. You're equipped to find the most critical information needed to manage and research investments.
Here are the key takeaways from today's lesson:
- The Dashboard is Your Command Center: It shows your total account value, buying power, and a summary of your holdings.
- Holdings/Positions Show What You Own: This section details each investment you have, its current value, and its performance.
- The Stock Profile Page is Your Research Tool: Use it to find price charts, key statistics (like the 52-week range and volume), news, and analysis for any stock.
- Watchlists Help You Stay Organized: They allow you to monitor stocks you're interested in without having to purchase them.
In our next lesson, we'll zoom in on the stock profile page. We will learn how to read a stock quote to identify the current price, day's range, and volume. This will be our first step in learning to interpret the specific data points that drive investment decisions.