Hello! Welcome back to our exploration of fundamental analysis.
In the last lesson, we learned how to calculate the year-over-year growth of a company's total revenue and net income. This gave us a powerful way to measure a company's performance momentum. However, looking at total profit alone doesn't tell the whole story, especially when comparing companies of different sizes.
Today, we're going to dive into one of the most essential metrics in stock investing: Earnings Per Share (EPS). This lesson will show you how to take a company's total profit and break it down to a per-share level. Our goal is to define what EPS is and learn how to quickly locate it on a stock's financial data page. Understanding EPS is not just a technical exercise; it's a cornerstone for valuing a company and making informed investment decisions.
What is Earnings Per Share (EPS)?
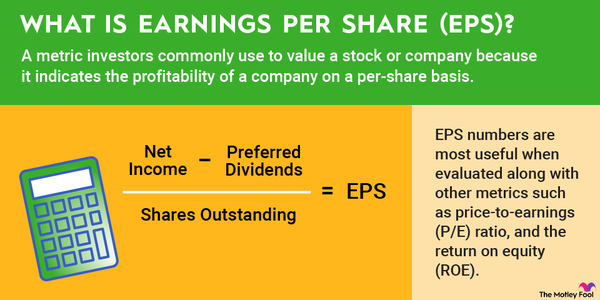
At its core, Earnings Per Share is exactly what it sounds like: it's the portion of a company's profit that is allocated to each outstanding share of common stock. Think of it as taking the company's entire net income (which we discussed in the last lesson) and dividing it up among all the shares.
To get a more intuitive feel for this, let's hear a practical explanation.
Mastering Stock Analysis on Yahoo Finance
The video 'Mastering Stock Analysis on Yahoo Finance' by Wallstreet Trapper offers a straightforward, conversational take on what EPS represents.
Watch the clip from 05:59 to 08:18. The speaker explains EPS as the amount of money a company has made 'per share' and connects it to the real-world context of earnings calls.
As the video explains, EPS helps standardize a company's profitability. Instead of just hearing that a company made billions in profit, EPS tells you what that profit means for a single share, which is the unit you actually buy as an investor.
The Formula for EPS
The formal calculation for EPS is quite simple and builds directly on the concept of Net Income.
The formula is:
Let's break down the components:
- Net Income: This is the company's total profit after all expenses, taxes, and interest have been paid. It's the "bottom line" we analyzed in previous lessons.
- Preferred Dividends: Some companies issue a special class of stock called "preferred stock" that pays a fixed dividend. These dividends must be paid out before any profit is available to common stockholders. Therefore, we subtract them from net income to find the earnings available to us, the common shareholders. Many companies do not have preferred stock, in which case this value is zero.
- Weighted Average Shares Outstanding: This is the average number of shares available to the public over a given period. The number can change as companies issue new shares or buy back their own stock, so an average is used for accuracy.
For a more detailed look at the formula and its components, the following resource is very helpful.
Earnings Per Share (EPS): What It Is and How to Calculate
The article 'Earnings Per Share (EPS): What It Is and How to Calculate' from Investopedia provides a thorough definition and breakdown of the EPS formula.
Please read the 'What Is Earnings Per Share (EPS)?' and 'Earnings Per Share Equation' sections. Pay close attention to the Key Takeaways, as they provide an excellent summary.
Why is EPS So Important for Investors?
Knowing the formula is one thing, but understanding why EPS is a critical tool is what makes it useful.
- Standardizes Profitability: EPS allows you to compare the profitability of different companies, regardless of their size or share price. A company with $10 billion in profit may sound more impressive than one with $100 million, but the EPS figure tells you how much profit is being generated relative to the number of shares, leveling the playing field.
- Tracks Performance: A company with a consistently growing EPS is a strong sign of a healthy, expanding business. An investor wants to see EPS increasing over time.
- A Key Component of Valuation: EPS is the "E" in the Price-to-Earnings (P/E) ratio, one of the most widely used metrics for determining if a stock is overvalued or undervalued. We will cover the P/E ratio in detail in our next lesson.
To see how EPS helps in comparing companies, let's watch a clear example.
What Is EPS In Stocks? | Earnings Per Share Explained
The video 'What Is EPS In Stocks?' by Rynance demonstrates with a simple example why EPS is more telling than total profit when comparing two different companies.
Watch the segment from 01:36 to 03:00. Notice how Bill's Bike Shop, despite having much lower total profit than Cameron's Carpets, is actually more profitable on a per-share basis. This is the power of the EPS metric.
How to Find EPS on a Financial Website
The good news is that for your day-to-day investing, you will rarely need to calculate EPS from scratch. Financial data websites like Yahoo Finance do the work for you. The key is knowing where to look and what the terminology means.
When you look up a stock quote, you will typically see EPS (TTM).
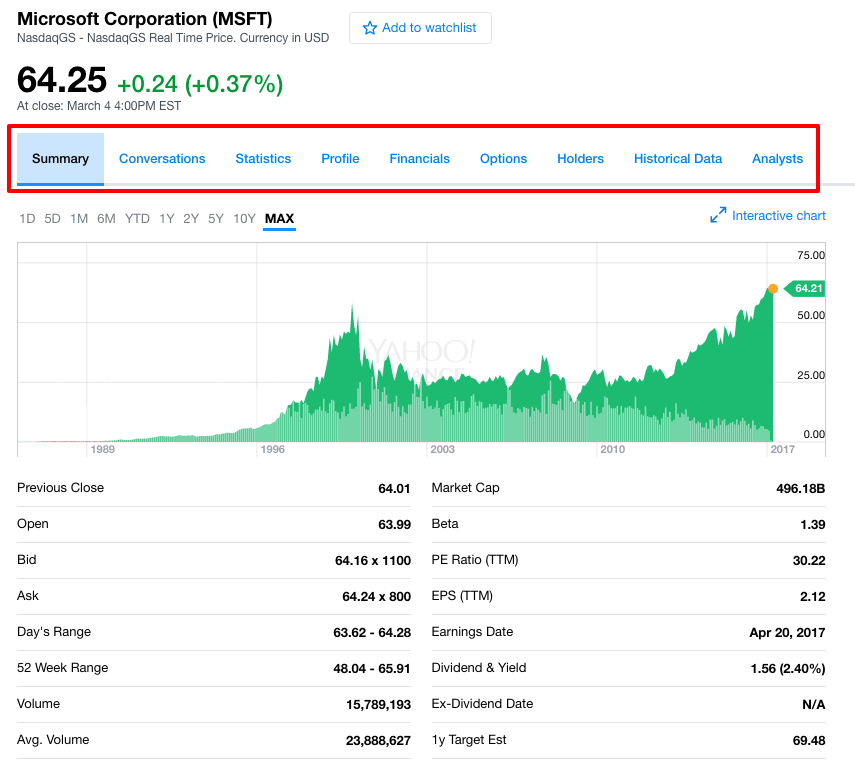
TTM stands for Trailing Twelve Months. This means the EPS value is calculated using the company's earnings over the last four quarters (one full year). This provides a more current and comprehensive view of profitability than just looking at the last quarter alone.
Let's read a quick explanation to solidify this.
Beginner's Guide to the Yahoo Finance Numbers [Updated]
The 'Beginner's Guide to the Yahoo Finance Numbers' clearly defines EPS (TTM) and shows another example of where to find it.
Find the heading 'EPS (TTM)' near the end of the article. Read this short section and look at the accompanying screenshot for Apple (AAPL). This will confirm your understanding of both the term and its location.
Test your understanding!
Time for a practical exercise.
- Open a new browser tab and go to a financial website like Yahoo Finance.
- In the search bar, type the ticker symbol for a company you are interested in (e.g., AMZN for Amazon, GOOGL for Google, or any other public company).
- On the 'Summary' page, find the value for EPS (TTM).
What is the EPS (TTM) for the company you chose? This simple action is something you will do countless times as an investor.
Show answer
The answer will vary depending on the company you chose and the day you look it up, as the TTM earnings are constantly updated. For example, on a given day, you might find that Apple's (AAPL) EPS (TTM) is around $6.43. The key is successfully navigating the page and identifying the correct metric.
An Important Distinction: Basic vs. Diluted EPS
When you dig deeper into financial reports, you may see two types of EPS listed: Basic EPS and Diluted EPS.
- Basic EPS is calculated using the formula we've discussed, based on the current number of shares outstanding.
- Diluted EPS is a more conservative "what if" calculation. It figures out what the EPS would be if all potential shares—from things like executive stock options or convertible bonds—were exercised. This would increase the total number of shares, thus "diluting" or lowering the EPS.
For this reason, Diluted EPS is often considered a more realistic and conservative measure of profitability. When you see EPS (TTM) on a site like Yahoo Finance, it is typically referring to Diluted EPS.
The Investopedia article you looked at earlier has an excellent section explaining this concept.
Earnings Per Share (EPS): What It Is and How to Calculate
Let's return to the Investopedia article to understand the difference between Basic and Diluted EPS.
Please read the section titled 'Basic EPS vs. Diluted EPS'. It provides a clear definition of both and includes a simple example of how dilution affects the final EPS number.
Conclusion
You have now mastered a fundamental pillar of stock analysis. You know what Earnings Per Share represents, why it is a more insightful measure of profitability than total net income, and most importantly, you know how to find it quickly for any public company.
Key Takeaways:
- Earnings Per Share (EPS) is a company's profit allocated to each individual share of stock.
- The formula is
(Net Income - Preferred Dividends) / Average Shares Outstanding. - EPS is crucial for comparing the profitability of different companies and tracking a single company's performance over time.
- You can easily find a company's EPS (TTM)—its earnings over the trailing twelve months—on financial websites like Yahoo Finance.
- Diluted EPS is a more conservative and often more realistic measure than Basic EPS because it accounts for potential new shares.
A Look Ahead:
This lesson has given us the "E" in one of investing's most famous acronyms: P/E. In our next lesson, we will introduce the "P" (Price) and learn how to calculate and interpret the Price-to-Earnings (P/E) ratio. This will be our first major step into the world of stock valuation—the art of determining whether a stock is cheap or expensive.