Hello! Welcome back to our journey into fundamental analysis.
In our last lesson, we learned how to analyze an income statement to spot trends, observing whether revenue and net income were moving in the right direction. We saw that a company with consistently growing sales and profits is often a sign of a healthy business. Today, we're going to put a precise number on that growth.
This lesson focuses on how to calculate the year-over-year growth rate for a company's revenue and earnings. Moving from qualitative observation ("it's going up") to quantitative analysis ("it's growing at 20% per year") is a critical skill. It allows you to objectively measure a company's performance, compare it directly to its competitors, and assess whether its growth is accelerating or slowing down.
What is Year-Over-Year (YOY) Growth?
Before we jump into the calculation, let's make sure we understand what "Year-Over-Year" (YOY) growth means and why it's so widely used in finance and investing.
At its core, YOY is a method of comparing a financial metric from one period against the same period in the previous year. For example, we might compare a company's revenue in 2023 to its revenue in 2022.
One of the main reasons investors use YOY comparisons is to smooth out seasonality. Many businesses have predictable cycles. A retailer, for instance, makes a huge portion of its sales during the fourth quarter (Q4) holiday season. Comparing its Q4 sales to its Q3 sales would be misleading; of course Q4 is higher. A much more meaningful comparison is to look at Q4 of this year versus Q4 of last year. This tells you if the company's holiday season performance is actually improving.
To get a formal definition and a deeper understanding of its importance, please read the first section of the following article.
How Investors Can Calculate Year-Over-Year (YOY) Growth
The article 'How Investors Can Calculate Year-Over-Year (YOY) Growth' from Yahoo Finance clearly defines YOY growth and explains its purpose in financial analysis.
Please read the section titled 'What Is YOY Growth?'. Pay attention to the example about retail companies and the holiday season to solidify your understanding of seasonality.
The Formula for YOY Growth
Now for the practical part. The calculation itself is straightforward and relies on a simple percentage change formula. You take the difference between the current year's value and the previous year's value, and then divide that difference by the previous year's value.
The formula is:
Let's break it down:
- Find the change:
Current Year Value - Previous Year Value - Divide by the starting point:
... / Previous Year Value - Convert to a percentage:
... * 100
For a quick walkthrough of this formula and a clear, simple example, the following resource is excellent.
YOY Growth Formula: Essential Guide for Accurate ...
This article, 'YOY Growth Formula: Essential Guide for Accurate Business Analysis,' offers a very direct explanation of the calculation.
Please read the section under the heading 'What is an example of calculating year-over-year growth?'. It provides a simple, clean calculation for a company's revenue growth.
As you can see, a positive result means growth, while a negative result would indicate a decline.
Calculating Revenue Growth in Practice
Let's see this in action. Finding the data and performing the calculation is a routine task for an investor. Financial data platforms like Yahoo Finance often pre-calculate this for you, but knowing how to do it yourself is essential for understanding what the numbers mean and for analyzing companies that may not be covered as closely.
This short video clip will show you exactly how to find the numbers and apply the formula using a real company, Tesla.
5-Minute Stock Analysis for Beginners | How to Analyze Any Stock
In this clip from '5-Minute Stock Analysis for Beginners' by Joseph Hogue, you'll see a live demonstration of calculating YOY revenue growth.
Watch the segment from 05:09 to 05:49. The presenter takes Tesla's revenue for two consecutive years from its income statement and calculates the YOY growth rate. Notice how he uses the formula we just discussed.
As you can see, you just need two numbers: this year's revenue and last year's revenue. With those, you can quickly quantify the company's top-line growth.
Calculating Earnings (Net Income) Growth
The great news is that the exact same formula applies to any metric you want to compare year-over-year. For earnings, we typically use the Net Income figure from the bottom of the income statement.
Let's work through an example together. The image below shows a simplified income statement for a company over three years. We can see both the Revenue (top line) and the Net Income (bottom line).
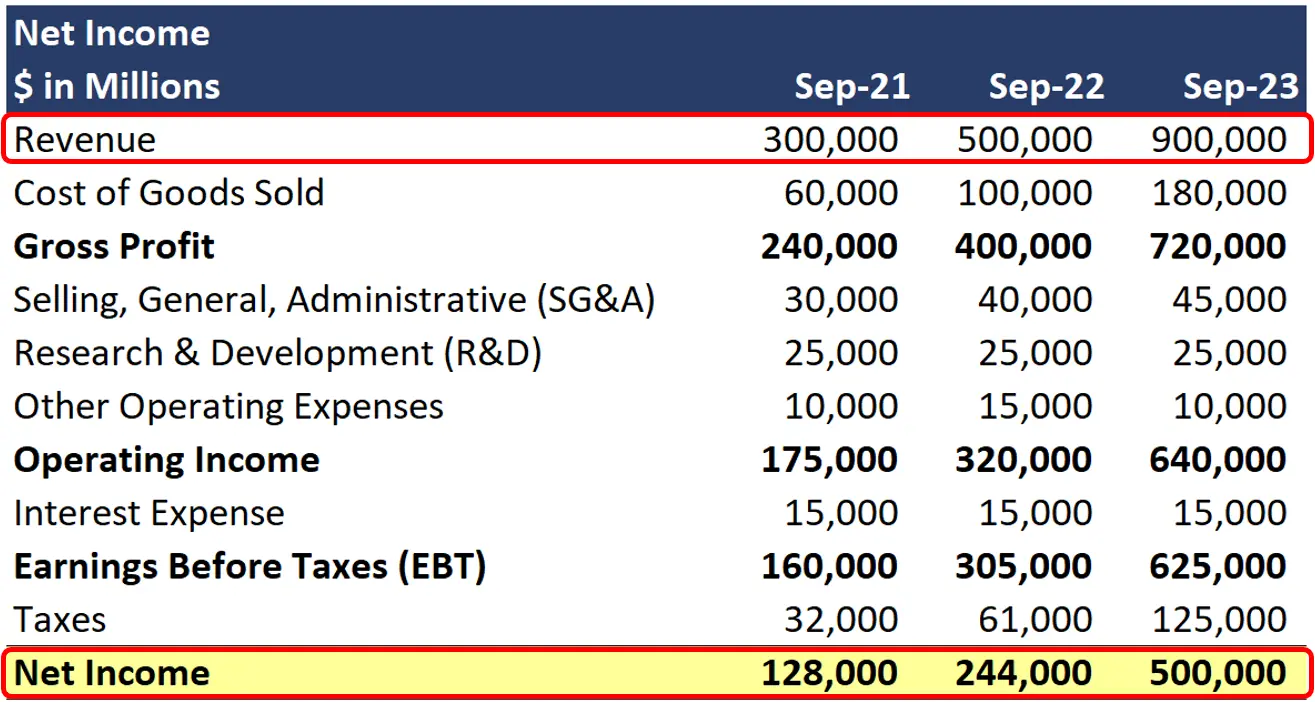
Let's use this data to calculate the growth from 2022 to 2023.
1. Revenue Growth (2022 to 2023):
- Current Year (2023) Revenue: $10,500 million
- Previous Year (2022) Revenue: $9,200 million
2. Net Income Growth (2022 to 2023):
- Current Year (2023) Net Income: $1,800 million
- Previous Year (2022) Net Income: $1,500 million
This analysis tells us something very interesting: in 2023, the company's net income grew faster than its revenue (20% vs 14.1%). This implies the company became more profitable during the year, which is a very strong positive signal for an investor.
Test your understanding!
Using the same income statement image above, calculate the following:
- YOY Revenue Growth from 2021 to 2022.
- YOY Net Income Growth from 2021 to 2022.
- Based on your calculations for both periods (2021-22 and 2022-23), what can you say about the company's growth trend?
Show answer
1. Revenue Growth (2021 to 2022):
- Current Year (2022) Revenue: $9,200 million
- Previous Year (2021) Revenue: $8,000 million
2. Net Income Growth (2021 to 2022):
- Current Year (2022) Net Income: $1,500 million
- Previous Year (2021) Net Income: $1,300 million
3. Analysis of Growth Trend:
- Revenue Growth: The revenue growth rate was 15.0% from 2021 to 2022, and it slightly slowed to 14.1% from 2022 to 2023. While still strong, this shows a slight deceleration in sales growth.
- Net Income Growth: The earnings growth rate accelerated significantly, from 15.4% in the first period to 20.0% in the second period. This is a very positive sign, indicating improving profitability even as revenue growth slightly cooled.
Conclusion
You have now added a fundamental quantitative tool to your investment analysis toolkit. By calculating year-over-year growth, you can move beyond simple observation and start to precisely measure a company's financial momentum. This skill is invaluable for comparing potential investments and tracking the health of companies you own.
Key Takeaways:
- Year-Over-Year (YOY) growth is the percentage change in a metric compared to the same period in the prior year.
- It is a crucial metric for removing the effects of seasonality and seeing the true underlying performance trend.
- The formula is simple and universal:
((Current Value - Previous Value) / Previous Value) * 100. - You can apply this formula to both revenue (the top line) and net income (the bottom line) to quantify a company's sales and earnings growth.
A Look Ahead:
In this lesson, we analyzed total net income. However, in the world of stock investing, it's common to break that profit down to a per-share level. In our next lesson, we will explore one of the most famous metrics in finance: Earnings Per Share (EPS). You'll learn what it is, how to find it, and why it's so important for valuation.