Hello! Welcome back to our module on evaluating companies.
In the last lesson, we explored the P/E ratio and learned how to gauge whether a stock's price is high or low relative to its earnings. This gave us a first look at valuation. But a crucial follow-up question is, "How good are those earnings?" Are they the result of an efficient, profitable business, or are they slim and precarious?
Today, we will answer that question by diving into the heart of a company's profitability. This lesson is designed to help you calculate and interpret gross, operating, and net profit margins to assess a company's profitability. Understanding these metrics will give you a much clearer picture of a company's financial health and operational efficiency, which is a vital skill for both long-term investing and active trading.
The Three Layers of Profitability
When you analyze a company, think of its profit not as a single number, but as a series of layers revealed on the income statement. Each layer tells a different part of the story about how the company makes money. The three most important layers are gross profit, operating profit, and net profit. We measure the efficiency at each of these layers using profit margins.
This flowchart provides a great visual overview of how we move from revenue down to the different levels of profit.
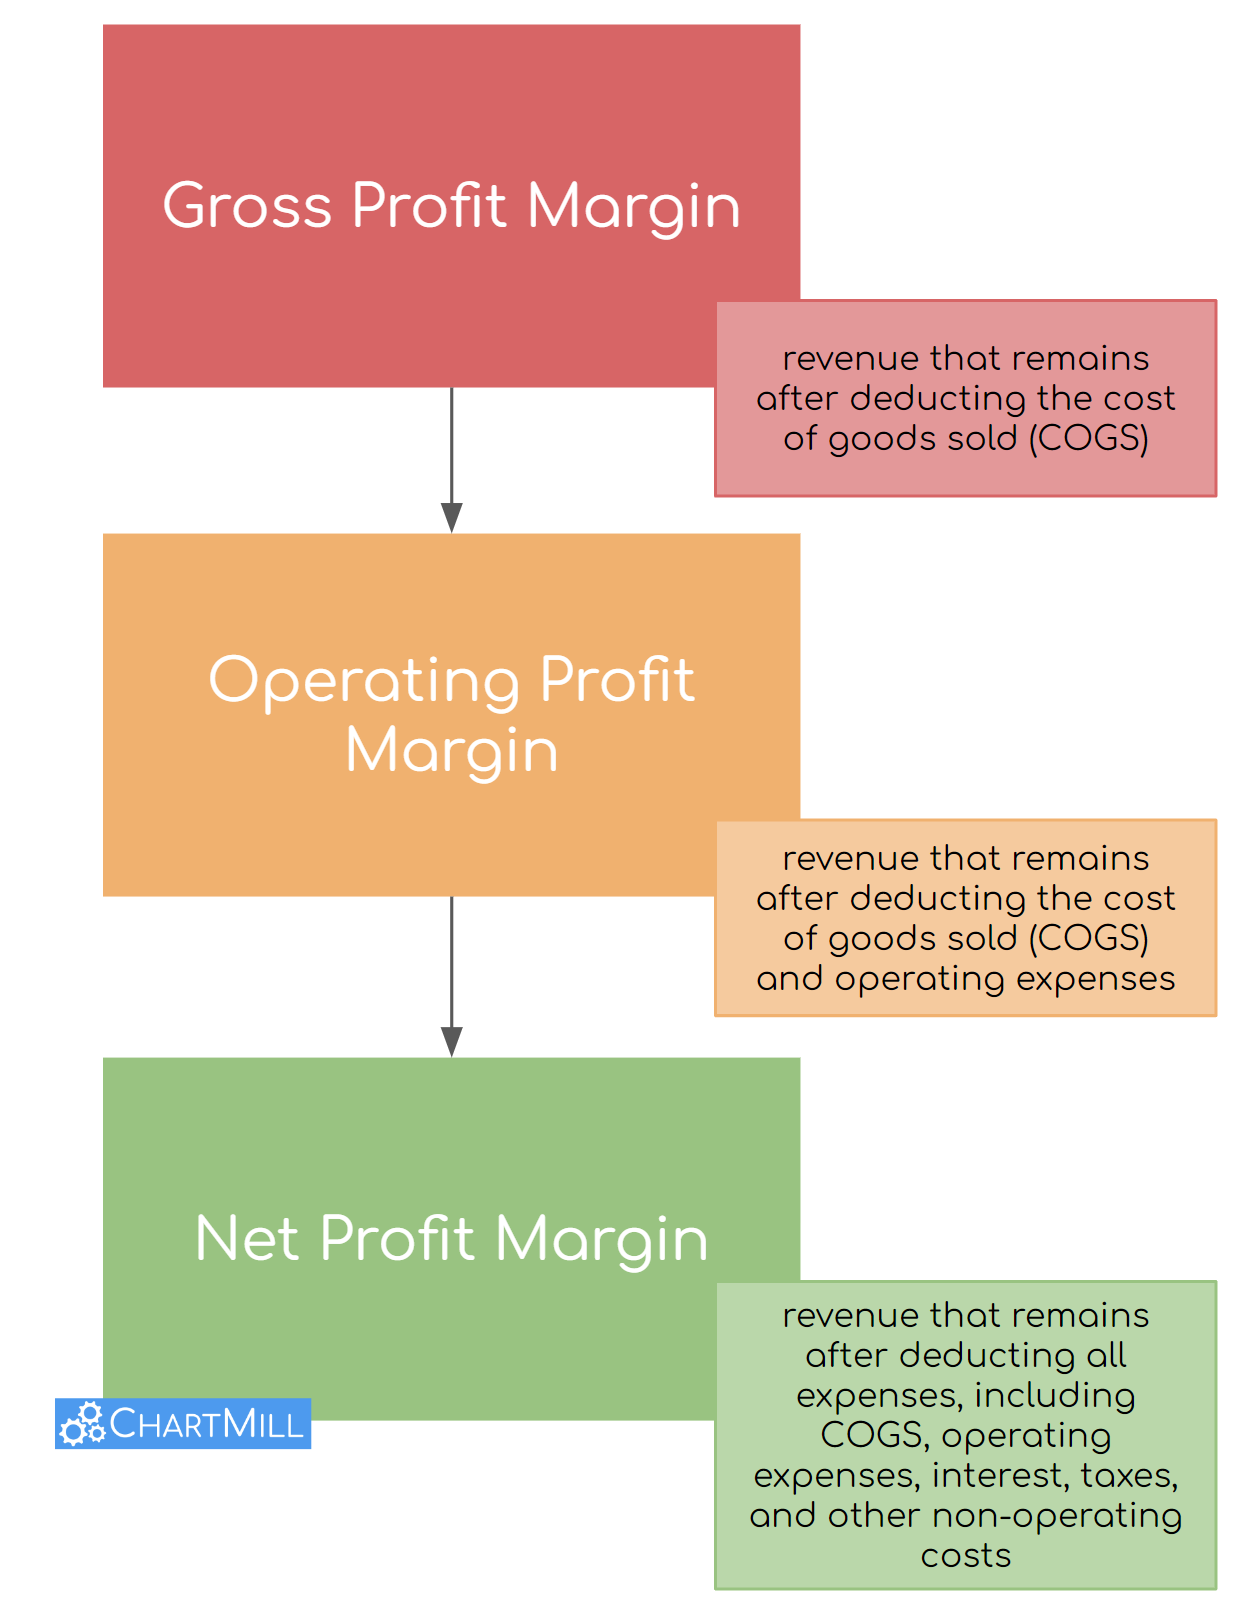
Let's begin by understanding the concepts behind each of these profit types.
What is Profit? (Gross Profit, Operating Profit, Net Income) | From A Business Professor
The video 'What is Profit?' from the Business School 101 channel offers a clear and concise introduction to the three key types of profit. This will help you build a solid conceptual foundation before we get into the calculations.
Please watch from 01:02 to 04:00. As you watch, focus on understanding the types of expenses that are subtracted to get to each level of profit: Gross Profit, Operating Profit, and Net Income.
Now that you have a conceptual overview, let's break down the margin calculation for each level.
1. Gross Profit Margin
The gross profit margin is the first and most basic level of profitability. It tells you how much profit a company makes from selling its product or service after accounting for the direct costs of creating it.
- Definition: The percentage of revenue left after subtracting the Cost of Goods Sold (COGS). COGS includes the direct costs tied to production, like raw materials and direct labor.
- Formula:
- What it tells you: It measures the profitability of a company's core product or service before any other expenses are considered. A high gross margin indicates that the company has a strong pricing power or an efficient production process. For example, a software company will have a very high gross margin because the cost to produce one more copy of their software is almost zero.
2. Operating Profit Margin
The operating profit margin takes the analysis one step further. It shows the profitability of the company's entire core business operation.
- Definition: The percentage of revenue left after subtracting COGS and all day-to-day operating expenses. These include things like salaries for non-production staff, marketing costs, rent, and research & development (R&D). The result, operating profit, is often referred to as EBIT (Earnings Before Interest and Taxes).
- Formula:
- What it tells you: This is a crucial metric for comparing the operational efficiency of different companies, because it isn't affected by how a company is financed (debt levels) or its tax situation. It purely reflects how well management is running the core business.
3. Net Profit Margin
This is the famous "bottom line." It represents the final profit a company makes after every single expense has been paid.
- Definition: The percentage of revenue remaining after all expenses have been deducted. This includes COGS, operating expenses, interest payments on debt, and taxes.
- Formula:
- What it tells you: It's the ultimate measure of profitability. For every dollar of sales a company makes, the net profit margin tells you how many cents are left over as pure profit for the owners (shareholders).
For a quick summary of these formulas in a clear table format, you can refer to the resource below.
Profit Margin | Formula + Calculator
The article 'Profit Margin' from WallStreetPrep provides a concise table that clearly lays out the formulas for gross, operating, and net profit margins.
Briefly review the table under the section 'How to Calculate Profit Margin'. This will serve as a quick reference for the formulas we've just discussed.
A Practical Walkthrough
Now let's see how this works in practice. We'll watch a video that takes a sample income statement and calculates all three profit margins step-by-step. This is a great way to see how these numbers are derived from the financial statements you learned to find in Module 7.
Profit Margin, Gross Margin, and Operating Margin - With Income Statements
The video 'Profit Margin, Gross Margin, and Operating Margin' from The Organic Chemistry Tutor provides an excellent, detailed walkthrough of calculating all three margins from a sample income statement.
Watch the section from 10:40 to 16:55. Follow along as the presenter calculates the missing values on the income statement and then computes the Gross, Operating, and Net profit margins. This will solidify your understanding of the formulas.
Test your understanding!
A company reports the following figures for the year:
- Revenue: $500,000
- Cost of Goods Sold (COGS): $200,000
- Operating Expenses: $150,000
- Interest and Taxes: $50,000
Calculate the company's Gross Profit, Operating Profit, and Net Income. Then, calculate the three profit margins.
Show answer
First, let's calculate the profit figures:
- Gross Profit = Revenue - COGS = $500,000 - $200,000 = $300,000
- Operating Profit = Gross Profit - Operating Expenses = $300,000 - $150,000 = $150,000
- Net Income = Operating Profit - Interest and Taxes = $150,000 - $50,000 = $100,000
Now, let's calculate the margins:
- Gross Profit Margin = ($300,000 / $500,000) * 100 = 60%
- Operating Profit Margin = ($150,000 / $500,000) * 100 = 30%
- Net Profit Margin = ($100,000 / $500,000) * 100 = 20%
Interpretation: What Makes a "Good" Margin?
Now for the most important part of your analysis: interpreting these numbers. A 20% net profit margin might be spectacular for one company and terrible for another. The golden rule, just like with the P/E ratio, is that context is everything.
1. Compare Within the Same Industry
Profit margins vary dramatically by industry due to different business models.
- Retailers like Walmart buy goods and resell them. Their COGS is very high, so their gross margin is low (e.g., ~25%). They make money on high volume.
- Software companies like Salesforce have a very low COGS because it costs little to sell another software subscription. Their gross margin is very high (e.g., ~75%), but they spend huge amounts on marketing and R&D, which lowers their operating margin.
Comparing Walmart's gross margin to Salesforce's is meaningless. You must compare Walmart to other retailers (like Target) and Salesforce to other software companies.
Profit Margin | Formula + Calculator
To see a real-world example of this principle, we'll return to the WallStreetPrep article. It contains a brilliant side-by-side comparison of Salesforce and Walmart that illustrates this point perfectly.
Read the sections 'Software Profit Margin Ratio Calculation Example' and 'Consumer Retail Profit Margin Analysis Example'. Pay close attention to the difference in the gross and operating margins between Salesforce and Walmart and the reasons provided for this difference.
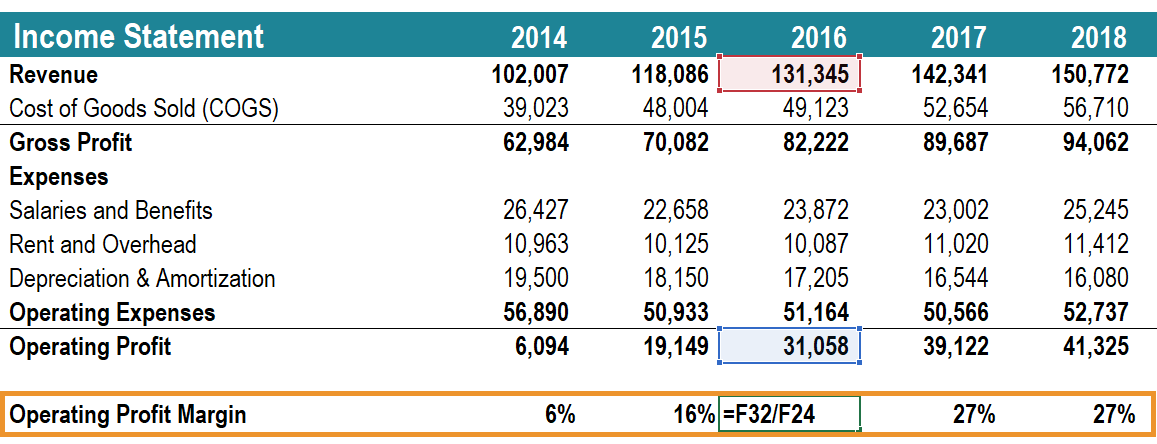
2. Analyze the Trend Over Time
Looking at a company's margins over several years is incredibly insightful.
- Improving Margins: This suggests the company is becoming more efficient, has stronger pricing power, or is managing its costs better. This is a very positive sign.
- Declining Margins: This can be a red flag. It might indicate rising costs, increased competition forcing the company to lower prices, or poor management.
Putting It All Together: A Practical Exercise
Let's apply what you've learned.
- Go to a financial website like Yahoo Finance.
- Look up the ticker for Microsoft (MSFT) and Walmart (WMT).
- Click on the "Statistics" tab for each company.
- Find the "Profit Margin" (this is the Net Profit Margin) and the "Operating Margin" under the "Profitability" section.
- Compare the margins for MSFT and WMT. Which company has higher margins? Based on what you've learned about their business models, explain why this difference exists.
This exercise will reinforce the crucial lesson that profit margins must be understood in the context of a company's industry.
Conclusion
You now have a new set of powerful tools for dissecting a company's financial health. While the P/E ratio tells you about the market's perception of a company's value, profit margins tell you about the reality of its operational performance. A company that can consistently generate strong and growing profit margins is often a hallmark of a high-quality business.
Key Takeaways:
- Profit margins measure how efficiently a company converts revenue into profit at different stages.
- Gross Margin reflects the profitability of the core product itself.
- Operating Margin reflects the profitability of the main business operations and is great for comparing efficiency between companies.
- Net Margin is the "bottom line" profit left for shareholders after all costs.
- The most important rules of interpretation are to compare margins within the same industry and analyze their trend over time.
A Look Ahead:
We've just analyzed a company's profitability at a specific point in time. But as an investor, you're most interested in the future. Is this profitable company growing, or is it stagnating? In our next lesson, we will learn how to calculate the year-over-year growth rate for a company's revenue and earnings to assess its growth trajectory.