Hello! Welcome to the eighth module of our course, where we begin to evaluate companies using key financial metrics.
In our last lesson, you learned how to use a company's investor relations website to understand its business model, its strategy, and its competition. We also saw how to locate the all-important Earnings Per Share (EPS) figure within a company's financial reports. Now, we're going to put that number to work.
Today's lesson focuses on one of the most widely used metrics in all of finance: the Price-to-Earnings (P/E) ratio. This single number helps you begin to answer a critical investment question: "Is this stock cheap or expensive?" By the end of this lesson, you will be able to calculate and interpret the P/E ratio to assess a company's valuation.
What is the P/E Ratio?
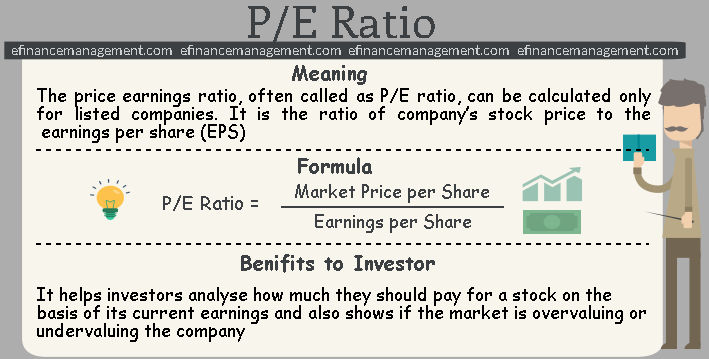
At its core, the P/E ratio is a valuation metric that compares a company's current stock price to its earnings. It tells you how much investors are willing to pay for every dollar of a company's profit.
To get a quick introduction to the concept and its calculation, let's watch the first part of this video.
PE Ratio Explained Simply | Finance in 5 Minutes!
The video 'PE Ratio Explained Simply' from the Rynance channel provides a concise and clear definition of the P/E ratio and demonstrates how to calculate it with a simple example.
Please watch from the beginning until 02:15. Focus on understanding the basic definition and the formula: Price per Share / Earnings per Share (EPS).
As the video explained, the formula is straightforward:
For example, if a company's stock trades at $100 per share and its EPS for the last year was $5, its P/E ratio would be:
This means investors are willing to pay $20 for every $1 of the company's annual earnings. Another way to think about this is that it would take 20 years for the company's earnings to "pay back" your initial investment, assuming earnings stay constant.
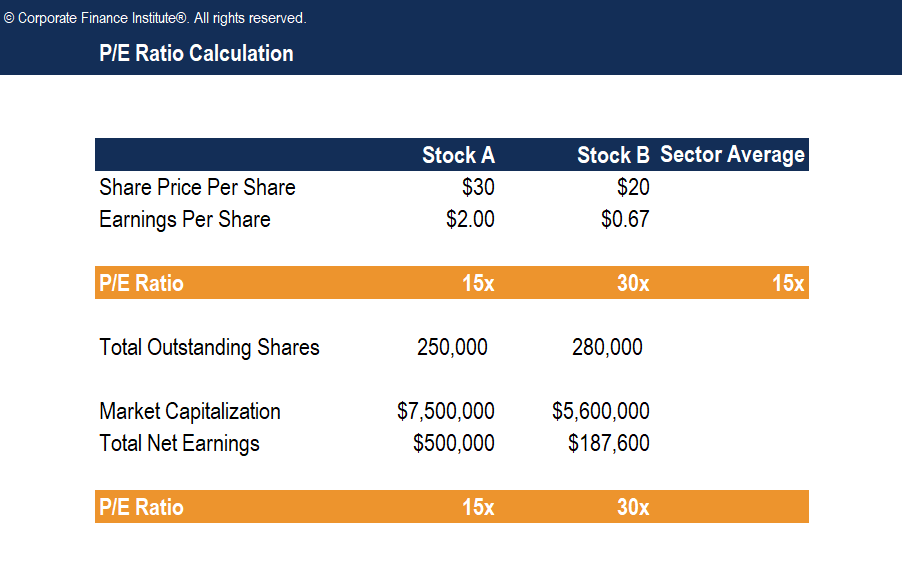
There is also an alternative way to calculate the P/E ratio using the company's total value instead of its per-share value.
Test your understanding!
A company's stock is trading at $150 per share. After reviewing its latest financial reports, you find that its Earnings Per Share (EPS) over the last twelve months was $7.50.
What is the company's P/E ratio?
Show answer
The P/E ratio is calculated by dividing the price per share by the earnings per share:
The company's P/E ratio is 20.
How to Interpret the P/E Ratio
Now that you can calculate the P/E ratio, what does the number actually tell you? Is a P/E of 20 good or bad? The answer is: it depends.
The Bakery Analogy
To build a strong intuition for what the P/E ratio represents, let's think about buying a whole business.
PE Ratio Explained (With Examples)
The video 'PE Ratio Explained (With Examples)' from the Intelligent Stock Investing channel uses a fantastic analogy of buying a local bakery to explain the P/E ratio. This will help you understand the concept in a very practical, real-world way.
Watch the section from 02:06 to 06:50. Pay close attention to how paying a different price (a different 'P') for the same amount of earnings (the 'E') results in a different P/E ratio and a different return on your investment.
As the video powerfully illustrates, a lower P/E ratio means you're paying less for the same amount of earnings, which implies a "cheaper" investment and a higher potential return. However, this is only part of the story.
The Golden Rule: Compare Within Industries
A P/E ratio is almost meaningless in isolation. Its true power comes from comparison. The most important comparison is with other companies in the same industry.
A mature utility company might have a P/E of 15, while a fast-growing tech company might have a P/E of 40. This doesn't automatically make the utility company a better buy. Their business models, growth prospects, and risks are completely different. It's like comparing the price of a pound of apples to a pound of steak—they aren't the same thing.
Let's see a practical example of this.
PE Ratio Explained Simply | Finance in 5 Minutes!
We'll return to the Rynance video, which does an excellent job of showing why industry context is crucial.
Watch from 02:15 to 04:40. Notice how comparing two bike companies makes sense, but comparing McDonald's (a restaurant) to Amazon (a tech and retail giant) is not a useful comparison.
To give you a practical sense of what's "normal," it's helpful to know the typical P/E ranges for different sectors.
Price-to-Earnings ratio explained: What it is and how to use it
This article from Saxo provides a great breakdown of typical P/E ranges across different industries and discusses how to use this information.
Read the sections 'How to use the P/E ratio in stock analysis' and 'Comparing P/E ratios by industry.' Focus on the table that shows the different P/E ranges for sectors like Technology, Financials, and Utilities.
The Critical Nuance: Growth Expectations
So if a lower P/E is generally "cheaper," why would an investor ever buy a stock with a high P/E ratio? The answer lies in one word: growth.
A high P/E ratio often signifies that the market has high expectations for the company's future earnings growth. Investors are willing to pay a premium today because they believe the "E" (Earnings) in the P/E ratio will grow significantly in the future, which could drive the stock price higher.
This is a critical concept that separates novice investors from experienced ones. A cheap stock (low P/E) that isn't growing might be a bad investment, while an expensive stock (high P/E) that grows its earnings rapidly could be a great one.
PE Ratio Explained (With Examples)
Let's go back to the 'Intelligent Stock Investing' video for a final, crucial lesson on how growth impacts your investment return over time.
Watch the segment from 06:50 to 09:26. This section clearly demonstrates how a company with a higher P/E but a faster earnings growth rate can ultimately be the better investment. This is a very important point.
This is where your interest in economics and psychology comes into play. The P/E ratio is as much a measure of market sentiment and future expectations as it is a financial statistic. A high P/E reflects investor optimism, while a low P/E can reflect pessimism or a lack of expected growth.
Trailing vs. Forward P/E
When you look up a P/E ratio on a financial website, you will often see two types:
- Trailing P/E (or P/E ttm): This is the most common type. It uses the Earnings Per Share from the past 12 months (ttm = "trailing twelve months"). It's based on actual, reported earnings.
- Forward P/E: This uses the estimated Earnings Per Share for the next 12 months. It's based on analysts' forecasts of future performance.
The Forward P/E can be very useful for growth companies, but remember that it's based on predictions, which can be wrong.
Practical Application and Limitations
Now, let's bring it all together. How do you find and use this in the real world?
PE Ratio Explained Simply | Finance in 5 Minutes!
Finally, let's see where to quickly find the P/E ratio for any stock on a popular financial website.
Watch the short clip from 04:40 to 05:11. It shows you exactly where to find the P/E ratio on Yahoo Finance, a skill you can apply immediately.
While the P/E ratio is a great starting point, it's not perfect. Be aware of its limitations:
- It's useless for unprofitable companies: If a company has negative earnings (a net loss), its P/E ratio will be negative or not applicable (N/A). You can't use it to value these companies.
- Earnings can be manipulated: Accounting rules can sometimes be used to make earnings look better than they really are.
- It ignores debt: A company might have a low P/E but be loaded with debt, which is a significant risk.
Because of the growth limitation, analysts often use the PEG (Price/Earnings-to-Growth) ratio, which adjusts the P/E for growth. We won't cover it in detail now, but it's an important next step in valuation analysis.
Test your understanding!
Time to put your new skill into practice.
- Go to a financial website like Yahoo Finance.
- Look up the stock tickers for Coca-Cola (KO) and PepsiCo (PEP). Find the P/E ratio for each. Are they similar? Why does this make sense?
- Now, look up the P/E ratio for Microsoft (MSFT).
- Compare Microsoft's P/E to those of Coca-Cola and PepsiCo. What does the difference tell you about market expectations for these different companies and industries?
Show answer
(Note: P/E ratios change daily, so your numbers will differ, but the principles remain the same.)
- KO and PEP: You would likely find that their P/E ratios are relatively similar. For example, KO might have a P/E of 25 and PEP a P/E of 27. This makes sense because they are direct competitors in the same mature industry (beverages and consumer-staple goods). They have similar growth prospects and business models.
- MSFT: You would likely find that Microsoft's P/E ratio is significantly higher, perhaps around 35.
- Comparison: The higher P/E for Microsoft indicates that investors have much higher expectations for its future earnings growth compared to Coca-Cola and Pepsi. As a leader in cloud computing and software, Microsoft is in a high-growth industry, and investors are willing to pay a premium for that growth potential. KO and PEP are stable, mature companies, so investors expect slower, more predictable growth, resulting in lower P/E ratios.
Conclusion
You've just added a powerful tool to your investment analysis toolkit. The P/E ratio is a quick way to gauge a stock's valuation, but as you've learned, it requires context and a thoughtful interpretation.
Key Takeaways:
- The P/E ratio is calculated as Price per Share / Earnings per Share.
- It tells you how much you're paying for one dollar of a company's earnings.
- A low P/E can suggest a stock is "cheap," while a high P/E can suggest it's "expensive."
- The most important rule is to compare P/E ratios within the same industry.
- A high P/E ratio often reflects high market expectations for future earnings growth.
- The P/E ratio is a starting point for analysis, not a final verdict.
A Look Ahead:
We've just evaluated a company's price relative to its earnings. But how good are those earnings? How much of a company's sales revenue is actually converted into profit? In our next lesson, we will dig into profit margins. You'll learn how to calculate and interpret gross, operating, and net profit margins to assess a company's profitability and operational efficiency.