Hello! Welcome back to our module on evaluating companies.
In our last lesson, we dug into profit margins, which showed us how efficiently a company turns its sales into actual profit. This "bottom-line" profit, or net income, is the pool of money that belongs to the company's owners—the shareholders.
So, what does a company do with its profits? It has two main choices:
- Reinvest the money back into the business to fund growth (new factories, research, etc.).
- Distribute a portion of the profits directly to shareholders as a cash payment, known as a dividend.
Today, we'll focus on that second choice. This lesson will teach you to define and understand the key dividend metrics: dividend yield, payout ratio, and dividend growth rate. These metrics are fundamental for anyone interested in building a long-term income stream from their investments or for active traders looking for signals of a company's financial health and management discipline.
1. Dividend Yield: The "Interest Rate" on Your Stock
The first metric most dividend investors look at is the dividend yield. It’s a simple but powerful number that tells you how much cash income you’re getting back each year relative to the price you paid for the stock.
- Definition: The annual dividend per share divided by the stock's current price, expressed as a percentage.
- Analogy: You can think of it like the interest rate on a savings account. If you put $100 in a savings account with a 2% interest rate, you get $2 a year. If you put $100 into a stock with a 2% dividend yield, you get approximately $2 a year in dividends.
- Formula:
Let's watch a quick video that demonstrates how to calculate this with a real-world company.
Dividend Yield vs Dividend Growth Rate - Which Dividend Investing Strategy is BEST FOR ME
The video 'Dividend Yield vs Dividend Growth Rate' from the The Average Joe Investor channel provides a great step-by-step calculation for a well-known company, Procter & Gamble.
Watch from 01:37 to 03:00. Pay close attention to how the annual dividend and the current share price are used to calculate the yield.
Is a Higher Yield Always Better? The Dividend Yield Trap
Your first instinct might be to search for the stocks with the highest possible dividend yield. However, this can be a dangerous trap. A stock's yield can become very high for two reasons:
- The company is generously increasing its dividend (good).
- The stock's price is falling dramatically (often very bad).
When a stock's price collapses because the company is in trouble, the yield mathematically skyrockets. Unsuspecting investors might buy in, attracted by the high yield, only to see the company cut or eliminate the dividend entirely shortly after.
To dig deeper into this crucial concept, let's turn to a short article.
Key Metrics for Dividend Stock Investing
The article 'Key Metrics for Dividend Stock Investing' from MyCapitally does an excellent job explaining how to interpret different yield levels and, most importantly, how to spot the 'dividend yield trap'.
Read the entire 'Dividend Yield' section. Focus on understanding why a very high yield (e.g., above 6%) requires extra caution and what the 'dividend yield trap' is.
2. Dividend Payout Ratio: A Sustainability Check
If dividend yield tells you what you're getting, the dividend payout ratio tells you how sustainable that payment is. It answers the question: "What percentage of the company's profits is being paid out as dividends?"
This directly connects to our last lesson. The profit we are talking about here is the Net Income (or Earnings).
The images below provide a great visual intuition for this concept.
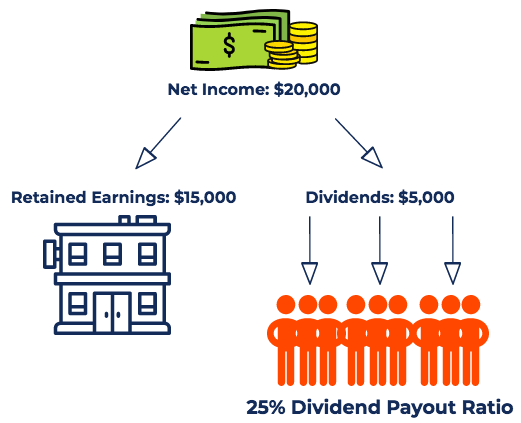

Now let's look at the formal definition and calculation.
What is the Dividend Payout Ratio | Lumovest
This short, clear video from Lumovest explains the two common formulas for the dividend payout ratio and the general difference between mature, stable companies and younger growth companies.
Watch the entire video. Pay attention to the two ways to calculate the ratio (using total company earnings or per-share figures) and why a growth company might have a low or zero payout ratio.
As the video explained, the two formulas are:
Payout Ratio = Total Dividends / Net IncomePayout Ratio = Dividend Per Share / Earnings Per Share (EPS)
A healthy payout ratio (e.g., 30-60%) suggests the dividend is well-covered by earnings and has room to grow. A ratio over 80% can be a warning sign that the dividend might be cut if profits fall, while a ratio over 100% means the company is paying out more than it earns—a clearly unsustainable situation.
3. Dividend Growth Rate: The Power of a "Raise"
For long-term investors, the growth of a dividend is often more important than its starting yield. A company that consistently increases its dividend signals financial strength and a commitment to its shareholders.
- Definition: The rate at which a company increases its dividend over time.
- Analogy: Think of it as getting an annual "raise" from your investment.
- Simple Formula (Year-over-Year):
Let's see how this is calculated and why it's so powerful.
Dividend Yield vs Dividend Growth Rate - Which Dividend Investing Strategy is BEST FOR ME
We'll return to the 'The Average Joe Investor' video to understand the dividend growth rate and see a compelling example of its long-term impact.
First, watch from 04:10 to 06:10 to understand how the year-over-year growth rate is calculated. Then, continue from 07:14 to 09:25 to see how a stock with a lower initial yield but higher growth can become a better income investment over time.
The comparison in the video is key: a 4% yield growing at 12% per year will eventually pay you more annually than a 5% yield growing at only 2% per year. This demonstrates the power of compounding and is a core principle for many long-term investors.
Test your understanding!
You are analyzing Company ABC and find the following information:
- Current Stock Price: $50
- Annual Dividend per Share this year: $2.00
- Annual Dividend per Share last year: $1.80
- Earnings per Share (EPS) this year: $4.00
Calculate the company's:
- Dividend Yield
- Dividend Payout Ratio
- Dividend Growth Rate (year-over-year)
Show answer
- Dividend Yield = ($2.00 / $50) * 100 = 4%
- Dividend Payout Ratio = ($2.00 / $4.00) * 100 = 50%
- Dividend Growth Rate = (($2.00 - $1.80) / $1.80) * 100 = 11.1%
This company has a solid 4% yield, a very sustainable 50% payout ratio, and a strong growth rate of over 11%. This combination of metrics looks very attractive on the surface.
Conclusion
You've now learned the three most important metrics for evaluating a dividend-paying stock. They work together to paint a complete picture: the yield tells you what you're paid now, the payout ratio tells you if that payment is safe, and the growth rate tells you what you might be paid in the future.
Key Takeaways:
- Dividend Yield: The current income return on your investment. Be wary of unusually high yields, as they can be a "dividend trap" caused by a falling stock price.
- Dividend Payout Ratio: The percentage of earnings paid out as dividends. This is a crucial indicator of dividend safety and sustainability.
- Dividend Growth Rate: Measures how quickly a company is increasing its dividend. For long-term goals, this can be more important than a high starting yield.
A Look Ahead:
We've defined the payout ratio and noted that it's a key indicator of safety. But how do we use it in practice? In our next lesson, we will focus specifically on how to assess the sustainability of a company's dividend using its payout ratio and other signs of financial health. This will equip you with the skills to avoid those dangerous dividend traps and find reliable income-producing investments.