Hello! Welcome back to our module on evaluating companies.
In our last lesson, you learned to define and calculate key dividend metrics: yield, payout ratio, and growth rate. We touched on the idea that the payout ratio—the percentage of earnings paid out as dividends—is a crucial check for sustainability.
Today, we're going to dive much deeper into that concept. A company's reported "earnings" can sometimes be misleading, as they don't always reflect the actual cash available. This lesson is all about equipping you with the practical skills to assess the sustainability of a company's dividend using its payout ratio and overall financial health. You'll learn to look past the surface-level numbers and determine if a dividend is truly safe or if it's a "dividend trap" waiting to be sprung.
1. The Flaw in Earnings: Net Income vs. Free Cash Flow
In the last lesson, we defined the payout ratio using net income (or earnings per share). While this is the most common method you'll see, it has a significant flaw. Net income is an accounting figure, not a cash figure. Dividends, however, are paid with cold, hard cash.
So, what's the difference? A company's net income can be reduced by several non-cash expenses. The most common are:
- Depreciation: The gradual expensing of a physical asset (like a factory or machinery) over its useful life.
- Amortization: The same concept, but for intangible assets (like patents or trademarks).
A company doesn't actually write a check for "depreciation" each year, but it's still subtracted from revenue to calculate net income. This means a company's net income can look low while its cash balance remains strong.
For dividend investors, a much more reliable metric is Free Cash Flow (FCF).
Free Cash Flow is the cash a company generates from its operations after paying for the capital expenditures necessary to maintain or expand its asset base (e.g., building new factories, upgrading equipment). Think of it as the discretionary cash left over that management can use to pay dividends, buy back shares, or pay down debt.
How to Choose Healthy Dividend Stocks || Net Income vs. Free Cash Flow
The video 'How to Choose Healthy Dividend Stocks' from The Average Joe Investor channel does an excellent job of illustrating this exact problem. It starts with a real company that has a net loss but is still considered a good dividend stock, which seems impossible until you understand Free Cash Flow.
Please watch the following sections: Start (00:00) to 03:06: Understand the core problem presented. 03:06 to 07:18: Focus on the clear definitions of Net Income and Free Cash Flow, and especially the explanation of non-cash expenses like depreciation. 07:55 to 10:50: This is the most important part. Watch how the presenter navigates a company's cash flow statement to find the actual Free Cash Flow and demonstrates that there is more than enough cash to cover the dividend, despite the reported net loss. This is a crucial practical skill.
As the video demonstrates, Free Cash Flow gives you the true picture of a company's ability to fund its dividend.
2. The Better Payout Ratio: Using Free Cash Flow
Now that you understand the importance of FCF, we can define a more robust payout ratio: the Cash Flow Payout Ratio.
- Earnings Payout Ratio =
Total Dividends / Net Income(what we learned last time) - Cash Flow Payout Ratio =
Total Dividends / Free Cash Flow(the more reliable metric)
So, what's a good number? While it varies by industry, here is a general guideline.
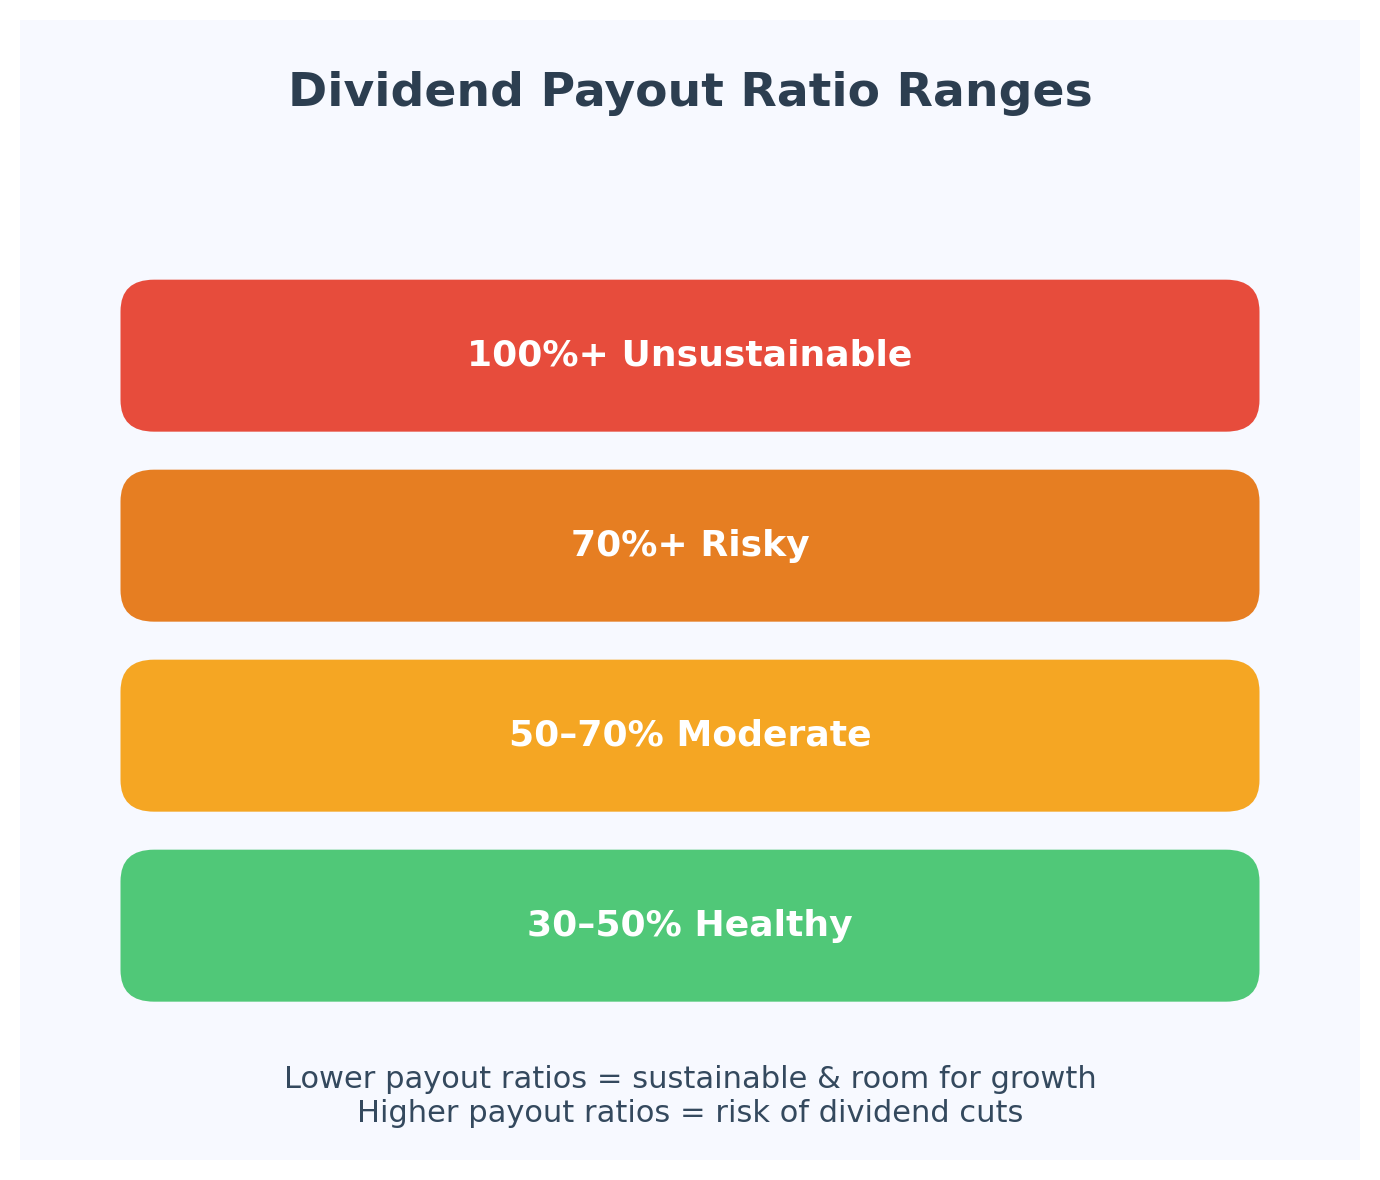
A payout ratio consistently below 75% of FCF is generally considered sustainable, leaving a "cushion" to protect the dividend if the business has a bad year. Let's see how to calculate this in practice.
The Safety Net System: How I Evaluate Companies’ Dividends
The article 'The Safety Net System' by Marc Lichtenfeld provides a perfect, step-by-step guide. It reinforces why FCF is the right metric and then walks you through calculating the FCF payout ratio for McDonald's using its actual financial statements.
Read from the beginning of the article down to the end of the section with the McDonald's example (ending just before 'When I’m determining my Safety Net grades...'). Focus on the calculation: (Cash Flow from Operations - Capital Expenditures) = Free Cash Flow, and then Dividends Paid / Free Cash Flow = Payout Ratio.
Test your understanding!
You are analyzing a company and pull these numbers from its Statement of Cash Flows:
- Cash Flow from Operations: $5 billion
- Capital Expenditures: $2 billion
- Dividends Paid: $2.25 billion
- Calculate the company's Free Cash Flow (FCF).
- Calculate its FCF Payout Ratio.
- Based on the visual guide above, how would you classify the sustainability of this dividend?
Show answer
- Free Cash Flow = $5 billion (Operations) - $2 billion (CapEx) = $3 billion
- FCF Payout Ratio = $2.25 billion (Dividends) / $3 billion (FCF) = 75%
- A 75% payout ratio falls into the "Risky" category. The company is paying out a large portion of its cash, leaving little room for error. While not immediately unsustainable, it warrants close monitoring.
3. More Than a Ratio: A Holistic View of Financial Health
A healthy payout ratio is necessary, but it's not sufficient. A company could have a low payout ratio today, but if its business is declining, that dividend won't be safe for long. You need to look at the bigger picture of the company's financial health.
Key areas to investigate include:
- Cash Flow Growth and Stability: Is FCF growing, shrinking, or volatile? A company with a consistent, growing stream of FCF is much more reliable.
- Debt Levels: A company with too much debt is at risk. During a recession, cash flow might drop, and the company will have to choose between paying its lenders and paying its shareholders. Lenders always get paid first.
- Dividend History: Does the company have a long track record of paying and, ideally, increasing its dividend? A multi-decade streak of dividend increases shows a strong commitment from management.
Let's watch a video that shows why context is so important.
The video '2023 Payout Ratio Explained' from the Dividend Guy channel provides excellent case studies that highlight the importance of context.
Watch the following three examples: Royal Bank (01:36 - 04:15): See how a company's payout ratio can fluctuate with the economy, and why looking at the long-term trend is more useful than focusing on a single quarter. 3M (05:12 - 08:19): This is a crucial example of a company with a decent payout ratio but declining revenues and earnings—a major warning sign about its future health. Starbucks (08:19 - 09:29): This shows how an external event (the pandemic) can cause a temporarily terrifying payout ratio (over 200%!), but because the underlying business was strong, it wasn't a long-term threat to the dividend.
These examples show that you can't just look at one number in one year. You must analyze the trend and the broader business context. A systematic approach can help.
The Safety Net System: How I Evaluate Companies’ Dividends
Let's return to the 'The Safety Net System' article. Now we'll look at how the author combines multiple factors into a single safety rating.
Read the rest of the article, starting from 'When I’m determining my Safety Net grades...'. Pay attention to the simple, yet effective, grading system that incorporates payout ratio, cash flow growth, and dividend history.
4. Putting It All Together: Spotting Safe Dividends and Avoiding Traps
A "dividend trap" is a stock with a high, enticing dividend yield that is ultimately unsustainable. The yield is high because the stock price has fallen due to underlying business problems. Investors who chase this high yield often lose money when the inevitable dividend cut happens.
Warning signs of a dividend trap:
- A payout ratio consistently over 100% of Free Cash Flow.
- Declining revenue, earnings, and cash flow.
- High and rising debt levels.
- A history of cutting the dividend in the past.
Conversely, a safe dividend is supported by strong financial health.

This dashboard for Caterpillar shows all the signs of a healthy dividend: a low payout ratio, manageable debt, and a long-term commitment to shareholders. This is the opposite of a dividend trap.
Conclusion
You've now moved beyond a superficial understanding of the payout ratio to a robust, practical method for judging dividend safety. You know that cash is king and that a holistic view is essential.
Key Takeaways:
- Free Cash Flow (FCF) is superior to Net Income for assessing a company's ability to pay dividends.
- The FCF Payout Ratio (
Dividends / FCF) gives you a more accurate measure of dividend sustainability. A ratio below 75% is a good starting point. - Context is crucial. A single payout ratio number is not enough. You must also analyze the trends in cash flow, the company's debt load, and its dividend track record.
- Be vigilant for dividend traps, where a high yield masks fundamental business problems like a high payout ratio and declining cash flow.
A Look Ahead:
In this module, you've learned to analyze a company's valuation (P/E ratio), profitability (profit margins), and dividend sustainability. Now it's time to put this knowledge to work. In our next and final lesson for this module, you will learn how to use a stock screener to filter for companies based on fundamental criteria like the ones you've just mastered. This will bridge the gap from theory to the practical task of finding investment ideas.