Hello and welcome back to our module on "Reading Charts and Market Behavior."
In the last lesson, we identified support and resistance levels—the key price zones where the battle between buyers and sellers intensifies. You learned that these levels tell you where a significant price move might stop or reverse. Today, we'll add a crucial layer to that analysis. We're going to explore trading volume, which helps you understand how much conviction is behind a price move.
The learning outcome for this lesson is to read volume bars to gauge the strength of a price move. Think of price as the car and volume as the fuel in the tank. A car can't go far without fuel, and a price trend is unlikely to be sustainable without the volume to back it up. Mastering this will give you a significant edge in confirming your analysis for both long-term investments and active trading.
What Is Volume and How Do You Read It?
First, let's establish a clear definition. Trading volume is simply the total number of shares of a stock that are traded (bought and sold) during a specific period. It measures market activity and interest.
On a chart, volume is typically shown as vertical bars at the bottom, directly below the price candlesticks. Let's watch a short video that explains this and shows you how to enable the volume indicator on a charting platform like TradingView.
🛑 STOP Trading Until You Learn VOLUME ANALYSIS...
The video 'STOP Trading Until You Learn VOLUME ANALYSIS...' by Mind Math Money provides a fantastic introduction to what volume is and how it's represented on a chart.
Please watch from 0:37 to 3:17. Pay close attention to the definition of volume and how the height and color of the volume bars correspond to the price action.
As the video explained, here are the key points for reading volume bars:
- Height: The height of the bar indicates the total volume traded during that period. A tall bar means high volume (lots of activity), and a short bar means low volume (little activity).
- Color: The color of the volume bar usually matches the color of the corresponding candlestick.
- A green volume bar corresponds to a green (up) candle, where the price closed higher than it opened. You can think of this as "buying volume" or buying interest.
- A red volume bar corresponds to a red (down) candle, where the price closed lower than it opened. You can think of this as "selling volume" or selling interest.
It's crucial to understand that a red volume bar doesn't mean there were more sellers than buyers. For every share sold, one must be bought. The color simply tells you that during that period of high activity, the sellers' pressure was strong enough to push the price down.
The Four Key Price-Volume Scenarios
The real power of volume analysis comes from observing its relationship with price. A price move on high volume is significant; the same move on low volume is questionable. This is a core principle with roots in the laws of supply and demand that you are familiar with from your interest in economics.
Let's break this down into four classic scenarios.
Understanding Trading Volume: Key Indicators and ...
The article 'Understanding Trading Volume' from Investopedia provides a great, structured explanation of these scenarios with chart examples. It will serve as an excellent reference.
Please read the following four short sections: 'What Rising Prices With Increasing Volume Indicate,' 'Analyzing the Impact of Rising Volume on Falling Prices,' 'The Significance of Decreasing Volume in a Downtrend,' and 'Weakening Trends: When Prices Rise but Volume Falls.' Focus on the logic behind each scenario.
Based on that reading, let's summarize the four scenarios in a table. This is a powerful mental model to use when looking at any chart.
| Price Action | Volume Action | Interpretation | Meaning |
|---|---|---|---|
| Price UP | Volume UP | Strong Trend | The uptrend is confirmed. There is strong, broad participation from buyers. |
| Price DOWN | Volume UP | Strong Trend | The downtrend is confirmed. There is strong, broad participation from sellers. |
| Price UP | Volume DOWN | Weakening Trend | Warning sign. The uptrend may be losing momentum. Fewer buyers are willing to participate at these higher prices. |
| Price DOWN | Volume DOWN | Weakening Trend | Potential positive sign. Selling pressure is easing. The downtrend may be nearing an end. |
This concept of "divergence" (when price and volume move in opposite directions) is a powerful signal that a trend's health is changing.
Practical Application: Confirming Breakouts and Reversals
Now, let's connect this directly to our last lesson on support and resistance. Volume is your best tool for validating whether a breakout or a reversal at these key levels is legitimate.
Confirming a Breakout
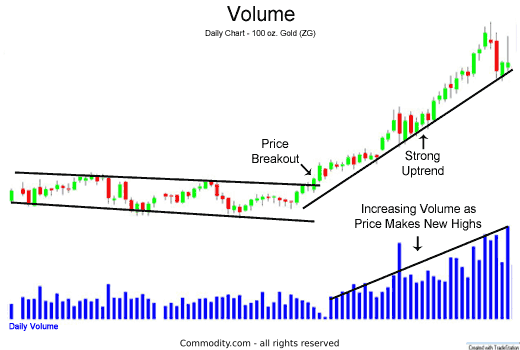
When a stock price breaks above a resistance level or below a support level, you want to see a spike in volume. High volume confirms that there is strong conviction and force behind the move, making it more likely to continue.
A breakout on low volume is suspicious. It suggests a lack of participation and increases the chance of a "fakeout," where the price quickly reverses back into its previous range.
Confirming a Reversal
Similarly, if a price hits a support level and bounces up, the reversal is much more convincing if the bounce occurs on high volume. This shows that buyers stepped in aggressively at that level. The same is true for a reversal down from resistance; a spike in selling volume adds credibility to the reversal.

Test your understanding!
Imagine a stock has been trading between $95 (support) and $105 (resistance) for several weeks. Today, it suddenly shoots up to $107. When you look at the volume bar for today, it is shorter than the average volume of the past month.
Is this a strong or weak breakout? What is the risk here?
Show answer
This is a weak breakout. The fact that the price broke above resistance on below-average volume is a red flag. It suggests there isn't enough buying pressure to sustain the move. The primary risk is a "fakeout": the price may quickly fall back below $105, trapping buyers who bought the breakout.
Gauging the Health of a Trend
Finally, you can use volume to monitor the health of an existing trend.
- In a healthy uptrend, you want to see volume increase as the price moves up (the impulsive waves) and decrease as the price pulls back (the corrective waves). This shows enthusiasm on the way up and a lack of selling pressure on the dips.
- In a healthy downtrend, you'd see the opposite: volume should increase on the moves down and dry up on the bounces.
Let's watch one last clip that neatly illustrates this concept and recaps the importance of volume in breakouts.
🛑 STOP Trading Until You Learn VOLUME ANALYSIS...
Let's return to the Mind Math Money video, which does a great job of explaining how to use volume to analyze trend health and confirm breakouts with real chart examples.
Please watch from 4:26 to 5:58 to see how volume behaves in a healthy trend, and then watch from 8:28 to 10:26 for a clear comparison of a real breakout (high volume) versus a fakeout (low volume).
Conclusion
You now have a powerful tool for adding depth and confirmation to your chart analysis. Price tells you what is happening, but volume helps you understand why and with how much force. By analyzing price and volume together, you can better distinguish strong, high-conviction moves from weak, indecisive ones. This skill is fundamental to both identifying long-term entry points and executing short-term trades with more confidence.
Key Takeaways:
- Volume measures market participation and the conviction behind a price move.
- High volume confirms a trend or breakout, signaling strong participation and sustainability.
- Low volume on a breakout suggests a "fakeout", indicating a lack of conviction.
- Divergence between price and volume (e.g., price rising while volume falls) is a warning sign that a trend may be weakening.
- Always analyze volume in the context of price action. They are two sides of the same coin.
A Look Ahead:
In our next lesson, we will step back and look at the bigger picture. The learning outcome is to recognize the characteristics of bull markets, bear markets, and market corrections to manage psychological biases. The extreme volume spikes you've learned about today often mark the psychological turning points of these major market cycles—the "capitulation" selling at a bear market bottom or the "euphoric" buying at a bull market top. Understanding this will be key to developing the emotional resilience you need as an investor.