Hello! Welcome back to our module on "Reading Charts and Market Behavior."
In our last lesson, you learned to recognize the market's three primary trends: uptrends, downtrends, and sideways channels. We saw how trendlines make these patterns visible, with an uptrend line acting as a floor for the price and a downtrend line acting as a ceiling.
Today, we will formalize and expand on that idea. The learning outcome for this lesson is to identify potential support and resistance levels on a price chart. These levels are the battlegrounds where the forces of supply and demand clash. Understanding them is one of the most fundamental skills in technical analysis, providing a framework for making more strategic decisions about when to buy or sell, for both long-term investing and active trading.
Defining Support and Resistance
At its core, support and resistance are about supply and demand, a concept you'll be familiar with from your interest in economics.
-
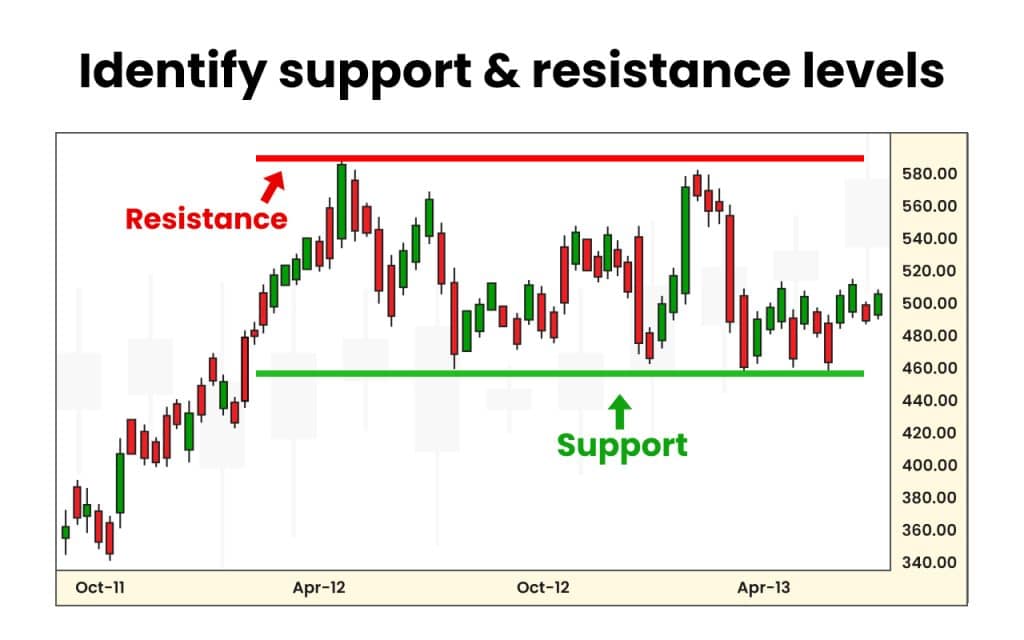
Support is a price level where demand is strong enough to prevent a stock's price from falling further. Think of it as a "floor" or a "trampoline." As the price gets cheaper and approaches this level, buyers become more interested, and sellers become less motivated to sell. This influx of buying pressure can halt the decline.
-
Resistance is the opposite. It's a price level where selling pressure is strong enough to stop the price from rising further. Think of it as a "ceiling." As the price gets higher and approaches this level, sellers are more eager to take profits, and buyers become hesitant to pay more. This increase in supply can stop the rally.
To see this concept explained visually, let's watch a brief introductory video.
How To Find Support and Resistance Levels For Beginners - Basic Introduction
This video from The Organic Chemistry Tutor provides a clear, foundational explanation of support and resistance. It connects these chart concepts directly to the psychology of buyers and sellers.
Please watch from the beginning to 2:48. Focus on how the narrator explains the balance of buying pressure at support and selling pressure at resistance.
The key idea is that these levels exist because of collective market psychology. Traders remember past price levels and tend to react when those levels are approached again. Your interest in psychology will be very useful here, as support and resistance are essentially a visual representation of the market's memory and emotional responses.
How to Identify Support and Resistance Levels
Now for the practical "how-to." Identifying these levels is a skill you'll hone with practice. While there are several methods, the most common is to look for historical price action.
The video below provides an excellent, systematic guide to finding strong, reliable support and resistance levels. It outlines a set of clear criteria that will serve as your checklist when analyzing a chart.
How To Find Support And Resistance Levels (Easily)
The video 'How To Find Support And Resistance Levels (Easily)' from Wysetrade is a highly practical guide. It breaks down the process into six clear criteria for identifying significant levels.
Please watch from 1:17 to 7:13. Pay close attention to the six traits the presenter lists for what makes a good support or resistance level. Then, watch how he applies each of these traits to real chart examples.
The Six Criteria for Strong Levels
As the video explained, you don't need all six criteria for a level to be valid, but the more a level has, the more significant it is. Let's recap them:
- Extreme Swing Highs and Lows: The absolute highest and lowest points on the recent chart.
- Multiple Rejections: The level has been tested multiple times, and the price has reversed each time. This is a very strong confirmation.
- Obviousness: The level should jump out at you. If you have to search hard for it, it's likely not significant, because other traders won't see it either.
- Drastic Moves Away: The price reverses sharply and powerfully away from the level.
- Acts as Both Support and Resistance: We'll cover this powerful concept, known as "role reversal," in a moment.
- Recency: Levels that were formed or respected recently are more relevant than very old ones.
Test your understanding!
You are looking at a daily chart of a stock. You notice that over the past six months, the price has risen to $150 three separate times, and each time it has fallen back down. According to the criteria above, why would $150 be considered a significant resistance level?
Show answer
The $150 level would be considered a significant resistance level primarily due to multiple rejections. The fact that the price failed to break above this level three times shows that sellers consistently stepped in at this price, making it a strong ceiling. Depending on the chart, it could also be an obvious level and a recent one.
Key Principles of Support and Resistance
Once you can draw the lines, you need to understand how they behave.
1. Role Reversal: Support Becomes Resistance (and Vice Versa)
This is one of the most reliable principles in technical analysis.
- When a price breaks below a support level, that old support level will often act as the new resistance on any subsequent rally.
- When a price breaks above a resistance level, that old resistance level will often act as the new support on any subsequent pullback.
The psychology here is fascinating. Imagine you bought a stock at $50 (a support level). The price then drops to $40. You're now at a loss and feeling regret. If the price rallies back to your breakeven point of $50, you're likely to sell just to get your money back. If enough traders who bought at $50 do the same, their selling creates a new wall of resistance at the old support level.
To solidify your understanding of these principles, please read a few sections from the Investopedia article 'Support and Resistance Basics.' This will reinforce the concepts of role reversal and other factors that determine a level's strength.
Please read the sections titled 'Support and Resistance Reversals' and the bullet points that follow it ('Number of Touches,' 'Preceding Price Move,' 'Volume at Certain Price Levels,' and 'Time'). Focus on understanding why a broken level can reverse its role.
2. Zones, Not Lines
As you might have noticed in the Wysetrade video, prices rarely stop at an exact line. It's more realistic to think of support and resistance as zones or areas. A price might dip slightly below support or poke slightly above resistance before reversing. Drawing a zone (like a shaded box) instead of a single line can help you avoid being faked out by minor, insignificant penetrations.
To see how to draw zones and why they are useful, let's return to the Wysetrade video.
How To Find Support And Resistance Levels (Easily)
This final clip from the Wysetrade video directly addresses the practical question of drawing lines versus zones.
Please watch from 12:58 to 16:32. The presenter gives a clear rationale for using zones to encompass the wicks and bodies of the candlesticks, making your analysis more robust.
3. Different Types of Support and Resistance
So far, we've focused on horizontal (or static) levels. But as you saw in the last lesson, trends create their own dynamic support and resistance.
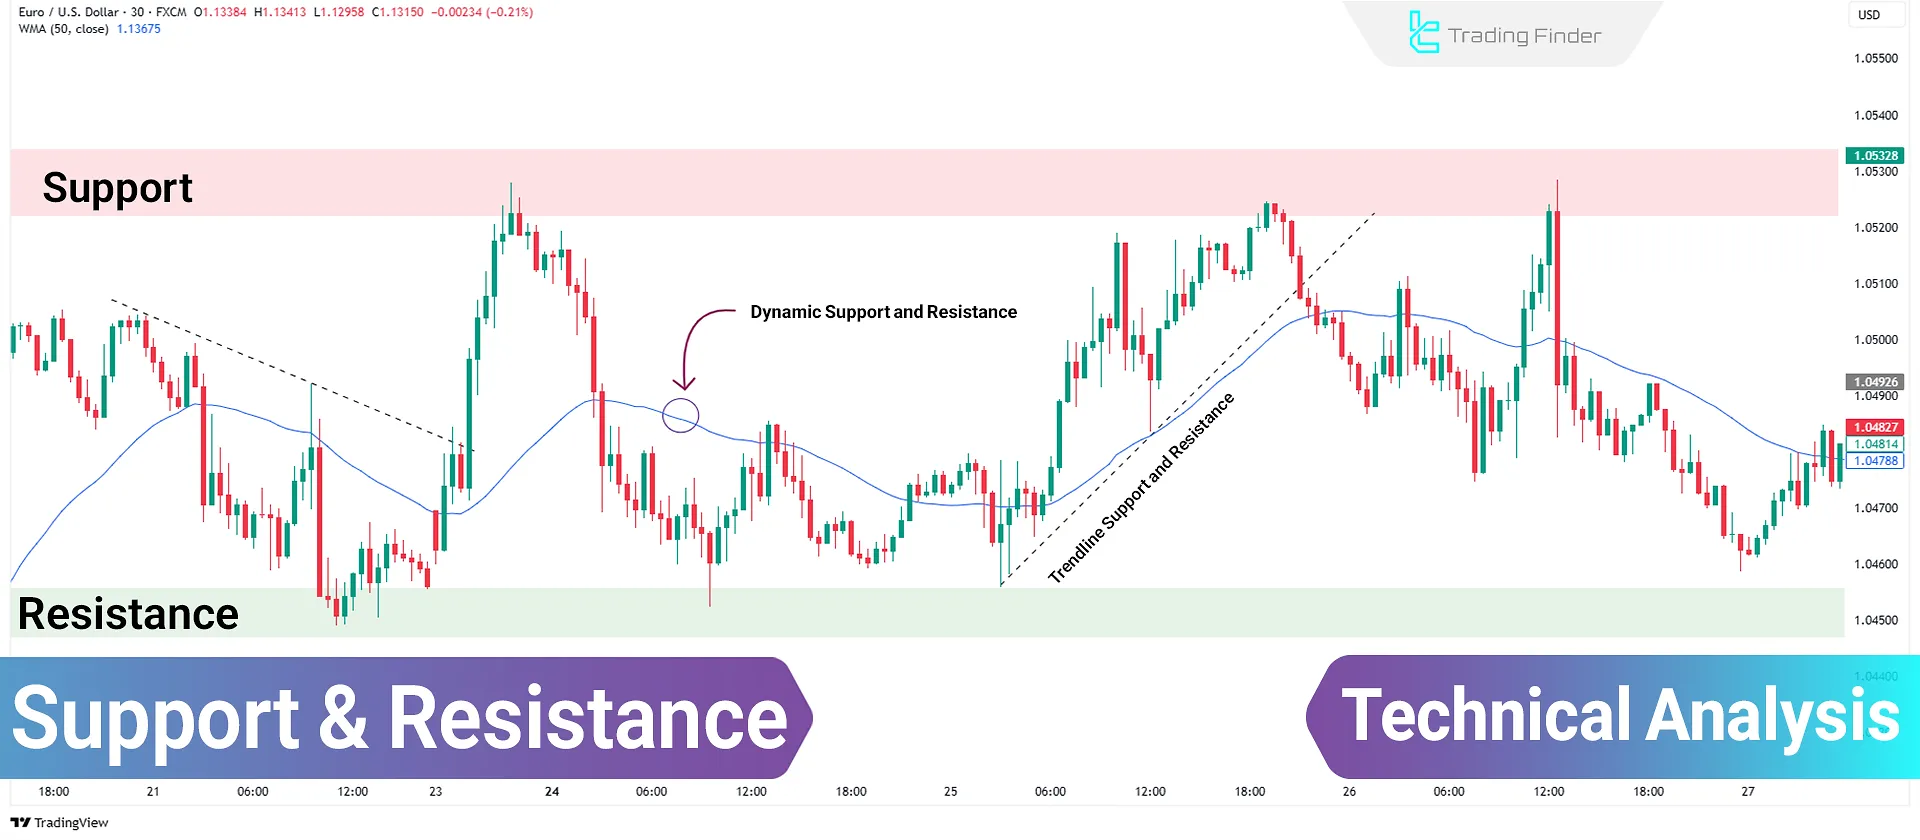
- Static Support/Resistance: Horizontal price levels that don't change over time.
- Dynamic Support/Resistance: Levels that change as the price moves. The most common examples are trendlines (which you already know) and moving averages, which we will cover in a future module.
Conclusion
You have now added a critical tool to your analysis toolkit. Being able to identify support and resistance moves you from just watching price movements to understanding the key levels where price is likely to react. This is a foundational step toward setting price targets, defining entry/exit points, and managing risk.
Key Takeaways:
- Support is a price "floor" where buying pressure tends to overcome selling pressure.
- Resistance is a price "ceiling" where selling pressure tends to overcome buying pressure.
- Look for levels with multiple touches, obviousness, and recency to find the most significant ones.
- A broken support level often becomes the new resistance, and a broken resistance level often becomes the new support (role reversal).
- It's often better to think of these levels as zones, not exact lines.
A Look Ahead:
In our next lesson, we will explore another crucial piece of the puzzle: volume. While support and resistance tell you where a significant price battle might occur, volume can tell you how strong that battle is. By learning to "Read volume bars to gauge the strength of a price move," you can better confirm whether a breakout from resistance or a bounce from support is likely to be sustained.