Hello! Welcome back to our journey through "Reading Charts and Market Behavior."
In our last lesson, we explored how using different timeframes—like a zoom lens—can give you a strategic, big-picture view (weekly charts) or a tactical, detailed view (daily or hourly charts). You learned that a trend on one timeframe might just be a minor blip on another.
Today, we're going to get precise. We'll move from just observing trends to formally identifying them. The learning outcome for this lesson is to recognize basic chart patterns such as uptrends, downtrends, and sideways channels. Mastering this is fundamental. It's like learning the grammar of market language, allowing you to understand the story the chart is telling about the balance of power between buyers and sellers. This skill is a cornerstone for both your long-term investing and active trading ambitions.
The Three States of the Market
At any given time, a stock's price is doing one of three things: going up, going down, or going sideways. These are the three fundamental trends that form the basis of technical analysis.
- Uptrend: A period where prices are generally moving higher. Buyers are in control.
- Downtrend: A period where prices are generally moving lower. Sellers are in control.
- Sideways Trend (or Range): A period of consolidation where prices move horizontally within a relatively stable range. This represents a balance or "tug-of-war" between buyers and sellers.

To get a feel for these trends in action, let's watch a short, engaging video that introduces them.
What is Up Trend, Down Trend and Sideways Trend | Technical Analysis Ep2 By CA Rachana Ranade
In this video, 'What is Up Trend, Down Trend and Sideways Trend' by CA Rachana Ranade, you'll get a clear, beginner-friendly introduction to these three patterns using real stock charts.
Please watch from 3:05 to 5:18. Pay attention to how she describes the characteristics of an uptrend, downtrend, and sideways trend. Notice how prices don't move in a straight line but in a series of ups and downs.
The Structure of a Trend: Higher Highs and Lower Lows
Visually identifying a trend is a good start, but for robust analysis, we need a more formal definition. Trends are defined by the structure of their peaks (highs) and troughs (lows).
Uptrend: Higher Highs and Higher Lows (HH & HL)
An uptrend is not just a rising price; it's a specific pattern that looks like a staircase climbing upward.
- Higher High (HH): The price reaches a new peak that is higher than the previous peak.
- Higher Low (HL): After pulling back from a high, the price finds a bottom (a low) that is higher than the previous low.
This HH & HL sequence is the signature of an uptrend. It tells you that buyers are consistently pushing prices to new heights, and during pullbacks, they are stepping in sooner (at a higher price) than they did before.
This diagram shows the classic 'stair-step' pattern of an uptrend, with each high being higher than the last, and each low also being higher than the last.
Downtrend: Lower Highs and Lower Lows (LH & LL)
Conversely, a downtrend looks like a staircase descending.
- Lower High (LH): After a temporary bounce, the price peaks at a level that is lower than the previous peak.
- Lower Low (LL): The price falls to a new trough that is lower than the previous trough.
This LH & LL sequence is the signature of a downtrend. It shows that sellers are in firm control, pushing prices to new lows, and any attempt by buyers to rally the price fails at a lower point than before.
This diagram shows the descending 'stair-step' pattern of a downtrend. Each successive high and low is lower than the previous one.
The following video provides an excellent, methodical demonstration of how to spot this exact structure on a chart. This is a crucial "how-to" skill for confirming what your eyes are telling you.
Episode 1: How To Confirm An Uptrend Or Downtrend
The video 'Episode 1: How To Confirm An Uptrend Or Downtrend' from Trade Confident will walk you through the process of marking higher highs, higher lows, lower highs, and lower lows on a chart.
Watch from 1:08 to 5:28. The presenter first identifies an uptrend by marking the Low, High, Higher Low, and Higher High. Then, he does the same for a downtrend. Try to follow along and spot the points on the chart before he reveals them.
Test your understanding!
A stock's price moves as follows:
- Starts at $100, rises to $110, then pulls back to $105.
- It then rallies to $118 and pulls back to $112.
Based on the structure of highs and lows, what kind of trend is this stock in?
Show answer
This is an uptrend.
- The first high is $110, and the second high is $118 (a Higher High).
- The first low is $105, and the second low is $112 (a Higher Low).
The sequence of Higher Highs and Higher Lows confirms the uptrend.
Visualizing Trends: Trendlines and Channels
Now that you can define a trend by its structure, the next step is to visualize it with a simple but powerful tool: the trendline. A trendline not only makes the trend obvious but also helps you anticipate where the price might go next.
To learn the basics of drawing trendlines and defining trends in text, take a few minutes to read this article.
Identifying trends: your guide to technical analysis
The article 'Identifying trends: your guide to technical analysis' from Wealthsimple provides a concise summary of trend types and a clear guide on how to draw trendlines.
Please read the sections 'Types of market trends' and 'How to draw trendlines'. Focus on the simple examples for each trend type and the rules for drawing lines for uptrends versus downtrends.
As the article explained, here are the key rules for drawing trendlines:
- For an Uptrend: Draw a line connecting at least two of the lows (the HLs). The more lows the line touches, the more significant it is. This line acts as a dynamic support level.
- For a Downtrend: Draw a line connecting at least two of the highs (the LHs). This line acts as a dynamic resistance level.
From Trendlines to Channels
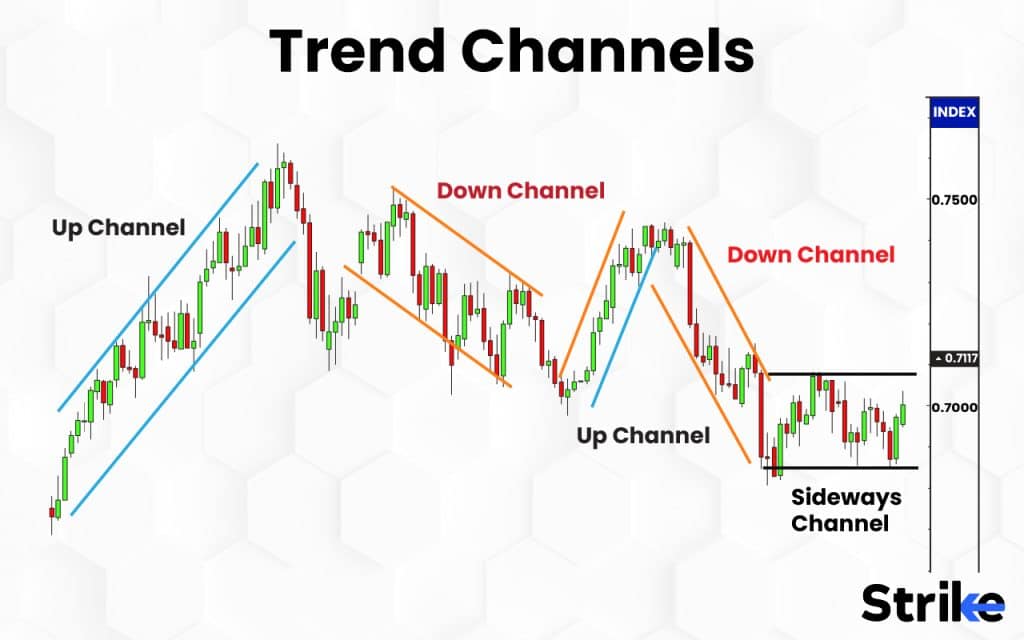
Often, price action is contained between two parallel lines, forming a channel. A channel gives you a more complete picture of the trend's boundaries.
- Up Channel: You have your uptrend line connecting the lows (support). If you draw a parallel line connecting the highs, you get an up channel. Price is expected to oscillate between these two lines as it moves higher.
- Down Channel: You have your downtrend line connecting the highs (resistance). A parallel line connecting the lows creates a down channel.
- Sideways Channel (Range): In a sideways market, you have a horizontal resistance line connecting the highs and a horizontal support line connecting the lows.
Practical Application: The Trend is Your Friend
Recognizing these patterns isn't just an academic exercise; it's the foundation for strategy. An old saying on Wall Street is, "The trend is your friend." This means you generally want to trade in the direction of the primary trend.
- In an uptrend, the path of least resistance is up. This is where you would typically look for buying opportunities, perhaps on a pullback to the trendline.
- In a downtrend, the path of least resistance is down. As a beginner, the best advice is to be cautious and avoid buying. The video you watched earlier offered a great piece of wisdom: "Never catch a falling knife."
- In a sideways channel, the market is in equilibrium. This can be a tricky place to trade. Often, the best strategy is to wait for a breakout (price moves decisively above the channel's resistance) or a breakdown (price moves decisively below the channel's support), as this can signal the start of a new trend.
Conclusion
Congratulations! You've now learned how to formally identify the market's most basic and important patterns. You can now look at a chart and not just see random price wiggles, but an organized structure that tells a story of who is in control.
Key Takeaways:
- The market moves in one of three ways: in an uptrend, a downtrend, or a sideways trend.
- An uptrend is defined by a series of Higher Highs and Higher Lows (HH & HL).
- A downtrend is defined by a series of Lower Highs and Lower Lows (LH & LL).
- Trendlines and channels are drawn on charts to visualize these trends and their boundaries.
- As a general strategy, it is often best to trade in the direction of the primary trend.
A Look Ahead:
In this lesson, we introduced the idea that trendlines and channel boundaries act as support and resistance. These are two of the most critical concepts in all of technical analysis. In our next lesson, we will focus entirely on them. You'll learn to identify potential support and resistance levels on a price chart, giving you the tools to better define your entry points, set price targets, and manage risk.