Hello! Welcome to your next lesson in the Statistical Inference and Estimation module.
In our last session, we learned how to construct and interpret confidence intervals. This gave us a way to quantify the uncertainty around a single estimate, like a model's accuracy. For example, we could say we are 95% confident that a model's true accuracy is between 89% and 95%.
But this raises a practical question: what if you develop a new model that gets 93% accuracy on the same test set, while the old one had 91%? Is that 2% difference a genuine improvement, or could it just be random noise from the specific data in your test set? Answering this requires a formal framework for comparing results and making decisions.
Today, you will learn the first and most crucial step in that framework. Your learning outcome is to formulate null and alternative hypotheses for A/B testing and model comparisons. This skill is fundamental to data-driven decision-making in both business and machine learning.
1. The Core Idea: Is It Real or Just Randomness?
Whenever we see a difference between two groups in our data—like a higher click-through rate for a new website design or better accuracy from a new model—we face a critical question: is this a real effect, or is it just due to random chance in our sample?
Hypothesis testing is the statistical procedure for answering this question. It helps us separate a meaningful "signal" from random "noise." The central idea is to start by assuming there is no effect and then see if our data provides enough evidence to convince us otherwise.
To get an intuition for this, let's watch a video that explains the problem of randomness and the purpose of hypothesis testing.
What is Hypothesis Testing ? Math, Statistics for data science, machine learning
This video from the 'codebasics' channel uses simple, relatable examples (like a drug trial and coin flips) to explain why we need a formal method to rule out randomness before concluding that an effect is real.
Watch the first 5 minutes and 39 seconds of the video. Focus on the core problem: how do we know an observed result isn't just a 'trick' of randomness?
2. The Language of Hypotheses: Null and Alternative
To conduct a test, we need to translate our question into two precise, opposing statements. These are the null hypothesis and the alternative hypothesis.
-
The Null Hypothesis (): This is the default position, the "status quo." It's a statement of no effect, no difference, or no relationship. Think of it as the "skeptic's view." In our model comparison example, the null hypothesis would be: "There is no difference in performance between the old model and the new model."
-
The Alternative Hypothesis ( or ): This is the claim we want to find evidence for. It's a statement that there is an effect, a difference, or a relationship. For our example, the alternative hypothesis would be: "The new model's performance is different from (or better than) the old model's."
The entire process works like a court trial, a great analogy you'll see in the next clip. We assume the null hypothesis is true ("innocent until proven guilty") and then look for strong evidence in our data to reject that assumption in favor of the alternative.
What is Hypothesis Testing ? Math, Statistics for data science, machine learning
This next segment from the same 'codebasics' video clearly defines the null and alternative hypotheses and explains the logic of trying to reject the null hypothesis, using the powerful courtroom analogy.
Watch from 5:39 to 8:24. Pay close attention to the definition of each hypothesis and the explanation of why we start by assuming the null hypothesis is true.
To solidify this, let's read a short, clear definition from an article focused on AI/ML.
Null Hypothesis in AI & ML: A Core Skill for Data Scientists
This article, 'Null Hypothesis in AI & ML', provides a concise definition of the null and alternative hypotheses, using the exact kind of e-commerce example that is common in industry.
Read the section titled 'What is the Null Hypothesis?' and the paragraph defining the 'alternative hypothesis' that immediately follows it. Focus on how H0 represents 'no significant difference' and H1 represents the effect you hope to demonstrate.
3. Application 1: A/B Testing
A/B testing is one of the most common applications of hypothesis testing in industry. Companies use it to test everything from website button colors to marketing email subject lines.
Let's say an e-commerce company wants to test if changing its "Buy Now" button from blue to green increases the conversion rate.
- Group A sees the blue button (the control).
- Group B sees the green button (the variant).
We want to compare the true population conversion rates, and . Our hypotheses would be:
- Null Hypothesis (): . There is no difference in conversion rate between the green and blue buttons.
- Alternative Hypothesis (): . The green button has a higher conversion rate.
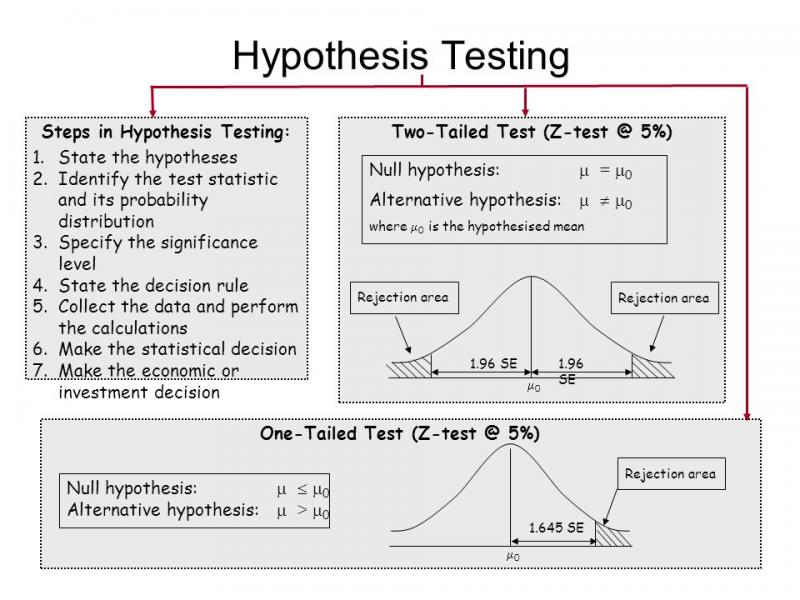
Notice that the alternative hypothesis is directional (). This is called a one-tailed test. We are specifically testing for an improvement. If we only wanted to know if there was any difference (better or worse), we would use , which is a two-tailed test.
This image helps visualize the difference.
Let's see one more crisp example from a data science interview perspective.
A/B Testing in Data Science Interviews by a Google Data Scientist | DataInterview
This short clip from a video on A/B testing by a Google Data Scientist shows how to formulate hypotheses for a real-world e-commerce case study comparing two ranking algorithms.
Watch from 8:04 to 8:37. Note how the null and alternative hypotheses are stated clearly in terms of the metric being measured (average revenue per day per user). In this case, they use a two-tailed test (( eq)).
4. Application 2: Machine Learning Model Comparison
This framework applies directly to your goal of building and justifying ML models. Every time you try a new architecture, add a feature, or tune a hyperparameter, you should ask: "Is this change producing a statistically significant improvement, or did I just get lucky on my test set?"
Let's formalize our earlier example. You have Model_Old and you've trained Model_New. You want to know if the new model is genuinely more accurate. Let and be the true (but unknown) accuracies of these models on all possible data.
- Null Hypothesis (): . The new model is not better than the old one. Any difference we see in our test set is due to random chance.
- Alternative Hypothesis (): . The new model is genuinely more accurate than the old one.
By testing this, you can provide statistical evidence to back up your claim that your new model is an improvement, which is exactly the kind of rigorous explanation you're aiming to provide.
The following reading details how to operationalize this for various ML tasks.
Null Hypothesis in AI & ML: A Core Skill for Data Scientists
This article, which we looked at earlier, also provides excellent examples of formulating hypotheses for specific machine learning workflows.
Read the section 'Operationalizing Null Hypothesis Principles in AI & ML Workflows'. Focus on the specific examples of formulating H0 for 'Model Performance Evaluation' and 'Feature Selection'. This directly connects the statistical concept to your daily work as an ML engineer.
Test your understanding!
You are an ML engineer at a streaming service. You've developed a new, more complex recommendation model (Model_B) that you believe will increase the average number of minutes users watch per day compared to the current model (Model_A). However, you are also concerned that its complexity might slow down recommendations and inadvertently decrease watch time.
You decide to run an A/B test to compare the two models.
- What is the key metric you are comparing?
- Define the population parameters you are comparing.
- Formulate the null hypothesis ().
- Formulate the alternative hypothesis (). Should this be a one-tailed or two-tailed test? Why?
Show answer
- Key Metric: Average minutes watched per user per day.
- Parameters:
- : The true average watch minutes per day for all users with
Model_A. - : The true average watch minutes per day for all users with
Model_B.
- : The true average watch minutes per day for all users with
- Null Hypothesis (): . There is no difference in the average watch time between the two models.
- Alternative Hypothesis (): . There is a difference (either positive or negative) in the average watch time between the two models. This should be a two-tailed test. Although you hope for an increase, you are also explicitly concerned about a potential decrease. A two-tailed test allows you to detect a statistically significant change in either direction.
Conclusion
Today you've learned the conceptual foundation of all hypothesis testing. By correctly formulating a null and alternative hypothesis, you create a clear, testable question from a real-world problem. This is the first and most important step in using data to make credible, defensible decisions.
Key Takeaways:
- Hypothesis testing is a formal procedure to determine if an observed effect in data is statistically significant or just due to random chance.
- The Null Hypothesis () is the default assumption of "no effect" or "no difference."
- The Alternative Hypothesis () is the claim you want to prove, stating that there is an effect.
- The process works by assuming is true and looking for evidence to reject it.
- This framework is used extensively in A/B testing (e.g., comparing website conversion rates) and ML model evaluation (e.g., comparing model accuracies).
- The choice between a one-tailed ( or ) and two-tailed () test depends on whether you're testing for a change in a specific direction or any change at all.
Preview of the Next Lesson:
Now that we know how to state our hypotheses, what's next? We need to figure out how to use our sample data to decide between them. In the next lesson, we will learn how to calculate p-values from test statistics and use them to make data-driven decisions. This will complete the core logic of hypothesis testing.