Hello! Welcome to the third module of our course, Statistical Inference and Estimation.
In our previous module, we explored key probability distributions, culminating in the powerful Multivariate Normal (MVN) distribution. We saw that distributions like the MVN are defined by a set of parameters—for example, a mean vector and a covariance matrix . This raises a crucial question that lies at the heart of all machine learning: if we have a set of observed data, how do we figure out the "true" parameters of the process that generated it?
This module is all about answering that question. We will bridge the gap between theoretical distributions and real-world data.
Today's lesson is the first and most fundamental step on this journey. Your learning outcome is to distinguish between population parameters and sample statistics in the context of model training. Understanding this distinction is the absolute foundation for making valid conclusions from data.
1. The Big Picture: From Population to Inference
In statistics, we are almost always interested in understanding a large group, but we only have data from a small part of it. This is the central challenge.
- A Population is the entire collection of individuals or items we are interested in studying (e.g., all users of a website, every house in a city, all possible images of a cat).
- A Sample is a manageable subset of that population that we actually collect data from (e.g., 1,000 users we surveyed, 500 house sales records, the 10,000 cat images in our training dataset).
The process of using a sample to draw conclusions about the population is called statistical inference.
This diagram provides a perfect visual map for the concepts we'll discuss today.
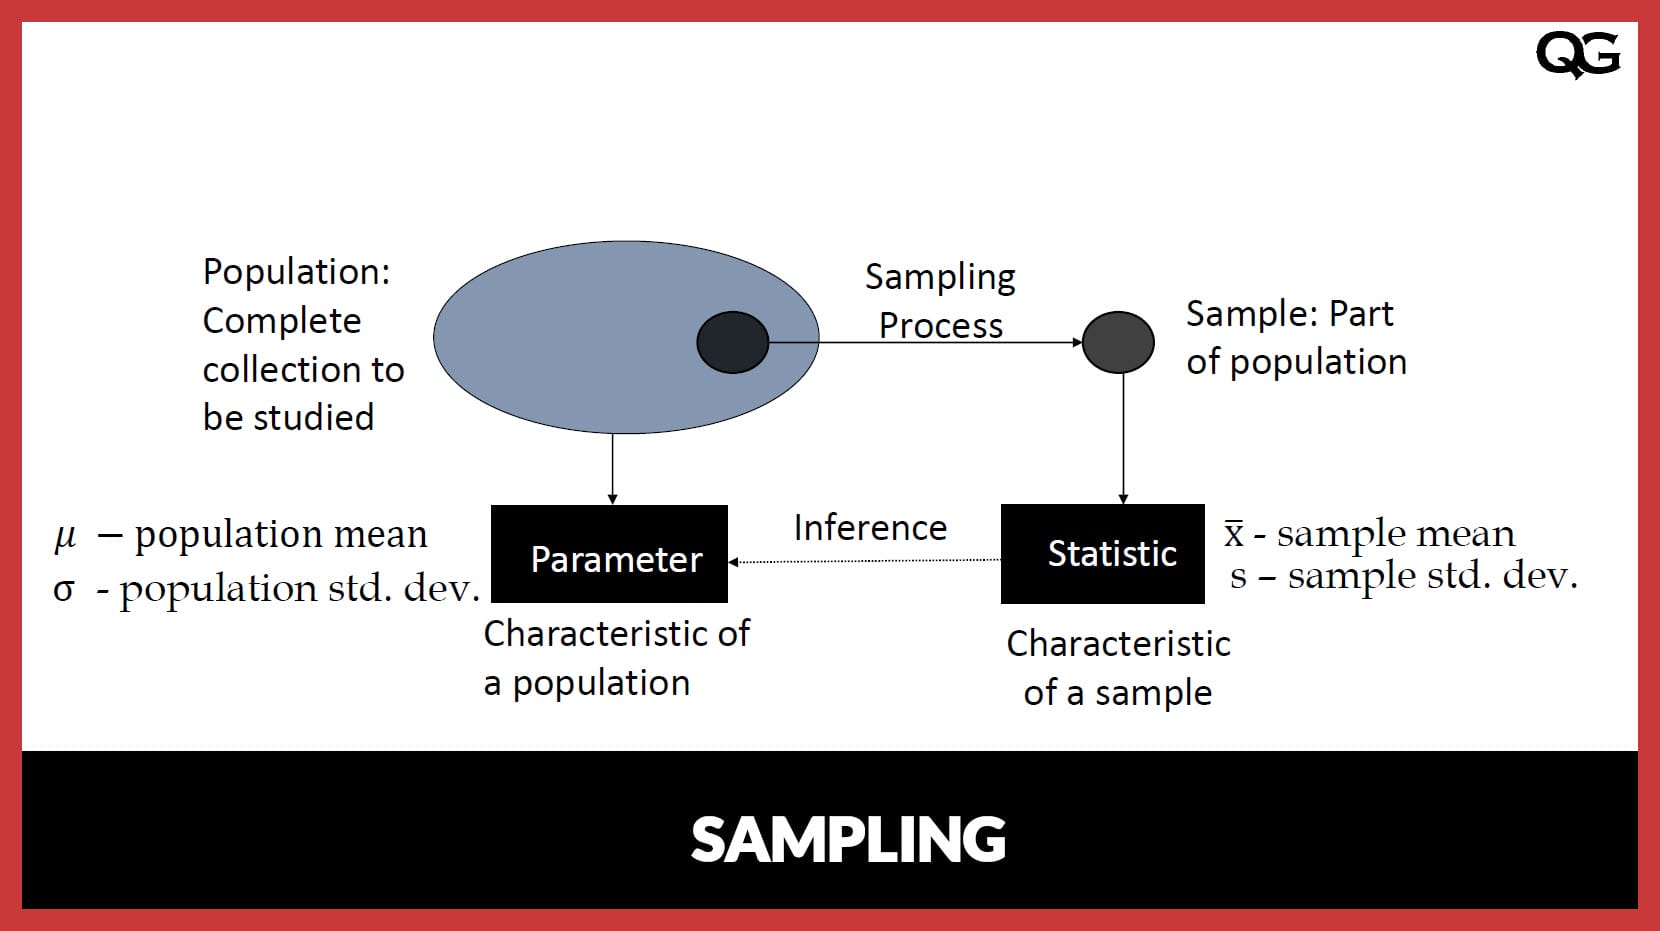
To solidify these initial definitions, let's watch a short video that explains the concepts and, importantly, why we need to sample in the first place.
Tutorial 5: Population vs Sample in Statistics| Data Science| Machine Learning
This clip from Neuraldata clearly defines 'population' and 'sample' and explains the practical reasons (like cost and time) for why we almost always work with samples.
Watch the video from 00:47 to 03:53. Focus on the definitions and the real-world motivations for using sampling, such as in exit polls.
As the video explains, studying the entire population is often impossible or impractical. In machine learning, your training data is your sample. Your goal is to train a model that performs well not just on this sample, but on the entire, unseen population of data.
2. Parameters vs. Statistics: The Crucial Distinction
Now we get to the core of today's lesson. We use different terms for numerical summaries depending on whether they describe a population or a sample.
- A Population Parameter is a numerical value that describes a characteristic of the entire population. Think of it as a fixed, true, but typically unknown value we want to find.
- A Sample Statistic is a numerical value calculated from our sample data. It's a value we can compute and therefore know. We use it as an estimate of the unknown population parameter.
The webpage below gives a very clear and concise summary of this distinction.
This article, 'Point Estimation Explained', clearly defines the terms and presents a helpful table comparing common parameters and their corresponding statistics.
Read the first two sections, up to (but not including) 'Common Point Estimators'. Focus on the conceptual difference between the 'fixed, true value' (parameter) and the 'calculated approximation' (statistic).
Let's summarize the key notation:
| Characteristic | Population Parameter | Sample Statistic |
|---|---|---|
| Mean | (or ) | |
| Standard Deviation | (or ) | |
| Variance | (or ) | |
| Proportion |
Now, let's watch a video from StatQuest that brings these ideas to life with a great visual example.
Population and Estimated Parameters, Clearly Explained!!!
Josh Starmer provides an excellent, intuitive walkthrough of these concepts. This first part will show you how a population's characteristics are described by parameters of a statistical distribution, like the normal distribution.
Watch from the beginning (00:21) to 07:05. Notice how the histogram of the entire population (all 240 billion liver cells) is perfectly described by a normal distribution with a specific mean (\mu) and standard deviation (\sigma). These are the population parameters.
This connects directly to our previous lessons. The population mean and standard deviation are precisely the parameters that define the shape and location of the theoretical normal distribution. If we were dealing with multidimensional data, the population parameters would be the mean vector and the covariance matrix that define the MVN distribution.
Now, let's see how the sample comes into play. The next clip makes a direct and important link to machine learning.
Population and Estimated Parameters, Clearly Explained!!!
Now that we understand population parameters, let's see how we use a small sample to estimate them.
Continue watching from 07:05 to 09:03. The key idea here is that we use our 'training data' (the sample) to calculate statistics that serve as our best guess for the true population parameters.
Test your understanding!
You are tasked with building a machine learning model to predict the price of used cars. You scrape a dataset of 50,000 car listings from a popular website. Your goal is to understand the average price of all used Toyota Camrys in the country.
- What is the population in this scenario?
- What is the sample?
- What is the population parameter you are interested in? Use the correct notation.
- What is the sample statistic you would calculate to estimate this parameter? Use the correct notation.
Show answer
- The population is all used Toyota Camrys for sale in the entire country.
- The sample is the subset of Toyota Camry listings included in your 50,000-listing dataset.
- The population parameter is the true average price of all used Toyota Camrys in the country, denoted by .
- The sample statistic is the average price of the Toyota Camrys in your dataset, which you calculate and denote by .
3. The Challenge of Sampling Variability
A crucial point is that our sample statistic's value depends entirely on the specific sample we happened to collect. If we took a different random sample, we would get a different sample mean . This is called sampling variability.
This might seem worrying. If our estimate changes every time, how can we trust it? Let's see how statistics addresses this.
Population and Estimated Parameters, Clearly Explained!!!
This final clip from StatQuest addresses the issue of sampling variability. It demonstrates two critical concepts: our estimates change from sample to sample, and our estimates generally get better as our sample size increases.
Watch from 09:03 to 12:50. Notice how the estimated mean gets closer to the true population mean as the sample size grows from 2 to 3 to 5. This is a fundamental concept in both statistics and machine learning.
This demonstrates a vital principle: larger samples tend to produce more accurate estimates. The error due to random chance (sampling variability) decreases as we collect more data. This is why having a large training dataset is so important in machine learning—it gives our model a more reliable estimate of the underlying patterns in the "population" of all data.
The video also briefly mentioned using p-values and confidence intervals to "quantify our confidence" in an estimate. This is the core of statistical inference, which we will dive into in the next lesson.
Conclusion
You have just learned the foundational concepts of statistical inference. This distinction between what we want to know (population parameters) and what we can compute (sample statistics) frames almost every problem in data analysis and machine learning.
Key Takeaways:
- Population vs. Sample: A population is the entire group of interest, while a sample is the subset of data we actually have.
- Parameter vs. Statistic: A parameter is a fixed, unknown numerical property of the population (e.g., true mean ). A statistic is a known, calculated numerical property of the sample (e.g., sample mean ).
- The Goal of Inference: We use sample statistics as point estimates for unknown population parameters.
- Sampling Variability: The value of a statistic varies from sample to sample. This variability generally decreases as the sample size increases.
- Connection to ML: Your training data is a sample. The model learns from this sample to approximate the true, underlying relationships (parameters) of the entire data population.
Preview of the Next Lesson:
We've established that a sample statistic provides a single "best guess," or point estimate, for a population parameter. However, because of sampling variability, this point estimate is almost certainly not exactly correct. So, how certain can we be? In our next lesson, we will learn how to construct and interpret confidence intervals, which provide a range of plausible values for the true population parameter, giving us a way to quantify the uncertainty in our estimate.