Hello! Welcome to your final lesson in the "Probability and Distributions for Modeling Data" module.
In our last lesson, we built and interpreted the covariance matrix, seeing it as a compact way to describe the variance within features and the linear relationships between them. You learned that for a set of variables, this matrix, denoted , is square, symmetric, and has the variances on its diagonal.
Today, we'll see the primary role of the covariance matrix in statistics and machine learning. We will use it, along with a mean vector, to define the Multivariate Normal (MVN) distribution. This is arguably the most important continuous distribution for modeling real-world, high-dimensional data.
Your learning outcome for this lesson is to describe the properties of a Multivariate Normal distribution and its importance in modeling. We'll explore its geometric shape and the powerful algebraic properties that make it a cornerstone of many ML algorithms.
1. From Univariate to Multivariate Normal
You are already familiar with the univariate normal distribution—the classic "bell curve"—which models a single continuous random variable. It's completely defined by two parameters:
- The mean (), which sets its center.
- The variance (), which sets its spread.
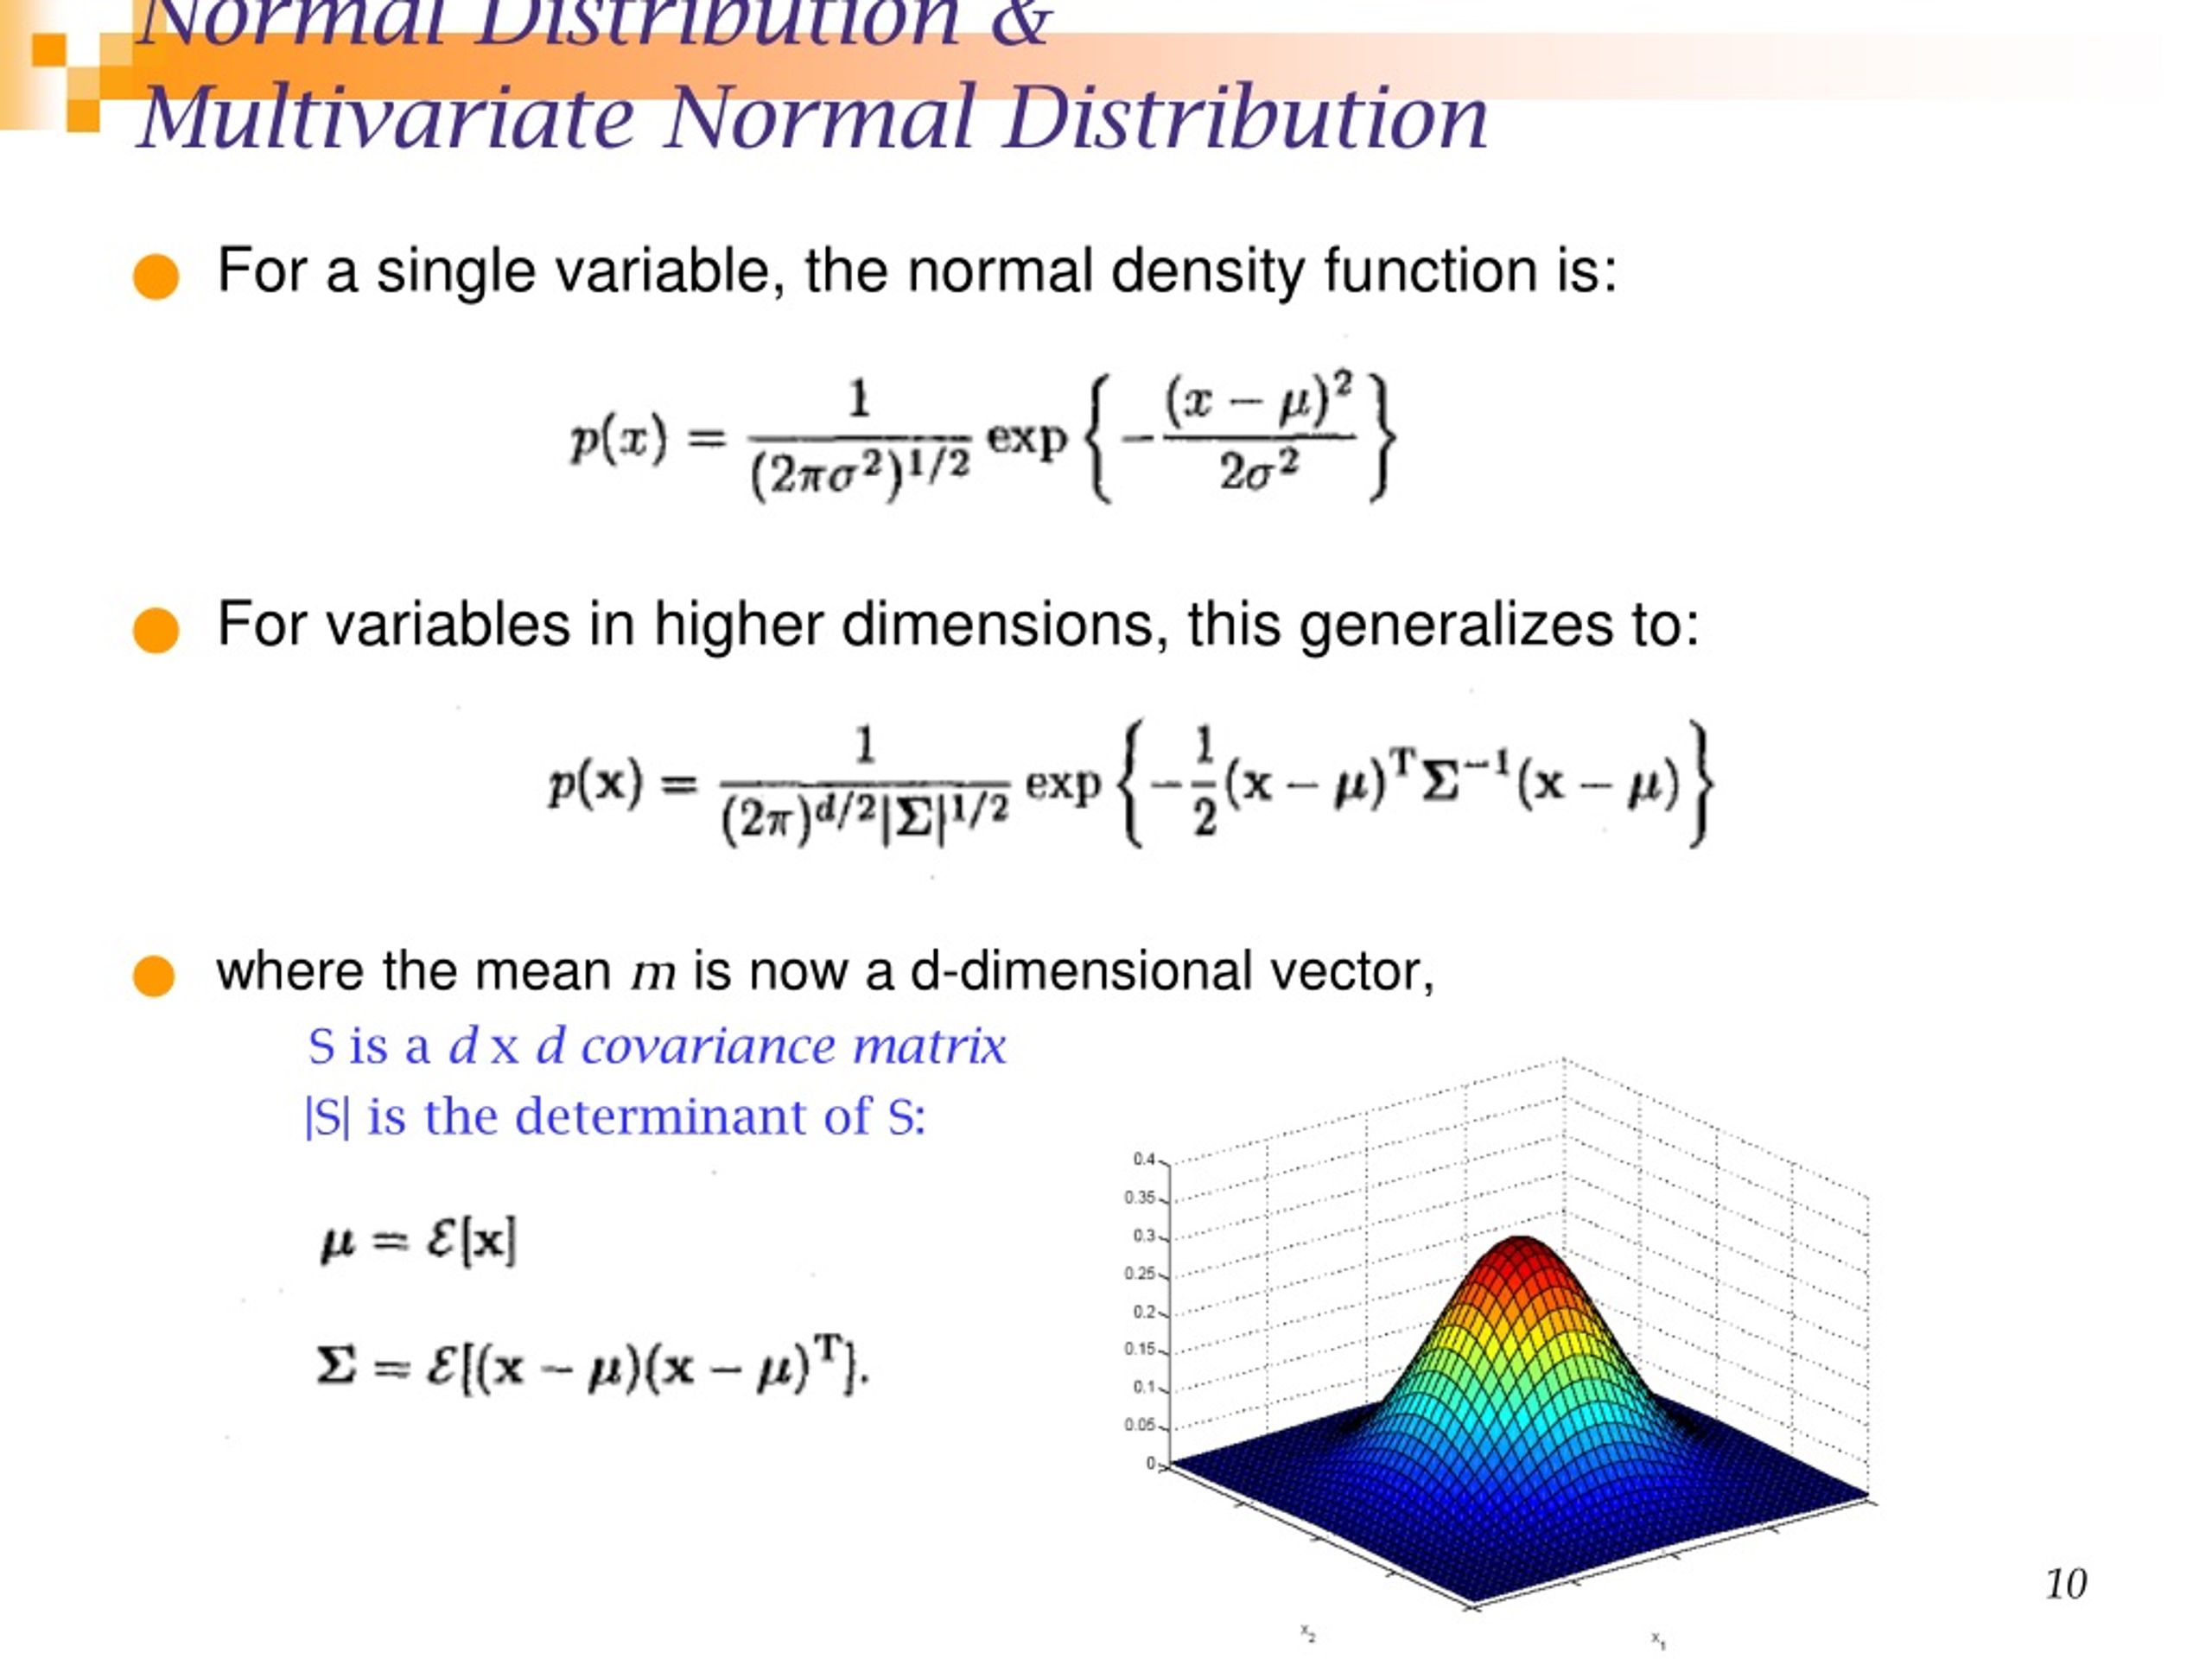
The Multivariate Normal (MVN) distribution is the natural extension of this idea to multiple dimensions, where we're modeling a vector of random variables. To do this, we simply upgrade our parameters from scalars to vectors and matrices:
- The mean becomes a mean vector , where each element is the mean of one variable. This vector defines the center of the distribution in a multi-dimensional space.
- The variance becomes a covariance matrix , which we studied in the last lesson. This matrix defines both the spread (variance) of each variable and the correlation between them.
To formalize this and understand the notation, let's watch the beginning of the following video.
Multivariate normal distributions
This video by Jack Baker introduces the vector notation used for the MVN and clearly defines its parameters.
Watch the first 4 minutes and 57 seconds. Focus on how a vector of random variables is denoted and how the mean vector and covariance matrix are used to parameterize its distribution.
The Probability Density Function (PDF)
Just as the univariate normal has a specific formula for its bell curve, the MVN has a PDF that defines its "bell surface" in higher dimensions. The formula is:
This might look intimidating, but it's a direct parallel to the univariate case. The term in the exponent, , is a matrix equivalent of the squared distance from the mean, scaled by the inverse of the covariance. This is what creates the elliptical or "bell" shape. This term is known as the Mahalanobis distance.
2. The Geometry of the Multivariate Normal Distribution
The true intuition for the MVN comes from understanding how the mean vector and covariance matrix define its shape.
- The Mean Vector : This is straightforward. It sets the center or peak of the distribution.
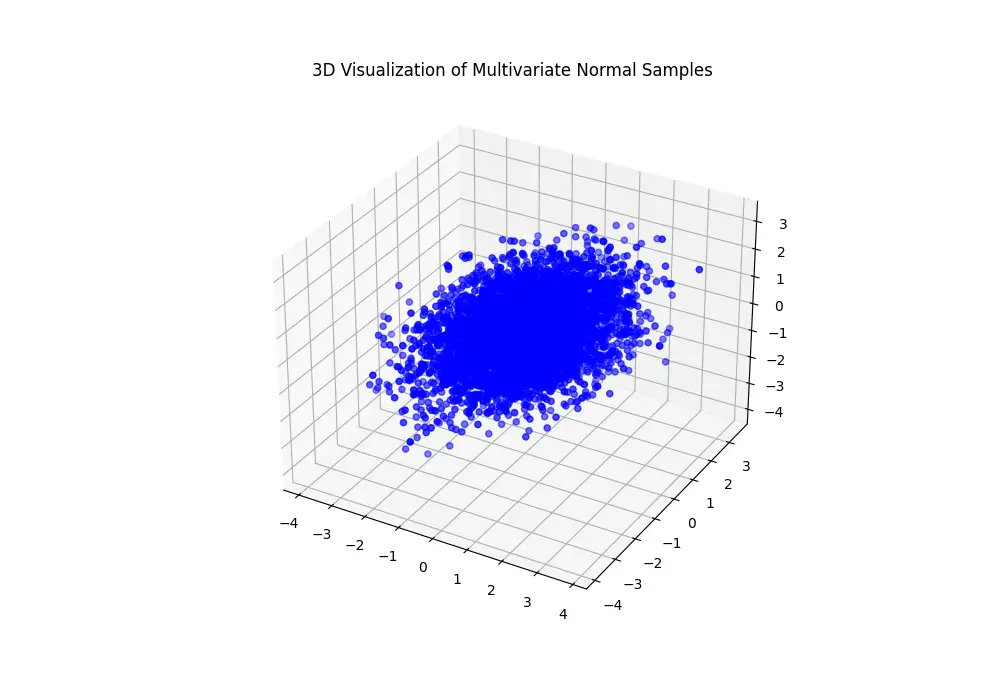
- The Covariance Matrix : This is where the magic happens. It determines the spread, shape, and orientation of the data cloud.
Imagine slicing through the 3D bell shape at a certain height. The outline of that slice will be an ellipse. These outlines are called contours of constant probability. The shape of these ellipses is dictated entirely by .
The following video provides an excellent geometric interpretation.
Multivariate Gaussian distributions
In this video, Alexander Ihler visually breaks down how the covariance matrix determines the shape of the distribution's contours.
Watch from 02:47 to 09:45. Pay close attention to these key ideas: The concept of elliptical contours of constant probability. The special case where the covariance matrix is diagonal, leading to axis-aligned ellipses. The general case, where the eigendecomposition of the covariance matrix reveals the orientation and lengths of the ellipse's axes.
As the video explained, the connection between the covariance matrix and the geometry of the distribution is one of the most beautiful concepts in multivariate statistics. Your background in linear algebra will be very helpful here.
- The eigenvectors of give the directions of the principal axes of the ellipse.
- The eigenvalues of give the variance along those principal axes. The larger the eigenvalue, the more spread out the data is along the corresponding eigenvector.
Test your understanding!
A 2D random variable follows a multivariate normal distribution with mean and covariance matrix:
- Are the variables and correlated?
- Describe the shape of the probability contours. Is it a circle, or an ellipse? If it's an ellipse, is it aligned with the axes or rotated? Which axis is it stretched along?
Show answer
- No, the variables are uncorrelated. The off-diagonal elements of the covariance matrix, which represent , are zero.
- The shape is an ellipse aligned with the coordinate axes. Because the variance of is 9 (and standard deviation is ) and the variance of is 1 (standard deviation is ), the ellipse is stretched along the -axis. It is three times as wide as it is tall.
3. Key Properties and Their Importance
What makes the MVN so useful in machine learning are its powerful and elegant mathematical properties. Understanding these helps explain why certain models work the way they do.
Let's explore some of these properties using the excellent distill.pub article and the bookdown.org chapter for reference.
A Visual Exploration of Gaussian Processes
First, let's read the introduction to the MVN from 'A Visual Exploration of Gaussian Processes'. It provides a concise summary of the key components.
Read the section 'Multivariate Gaussian distributions' to get a clear, text-based definition of the mean vector and covariance matrix.
Now let's dive into the properties.
Property 1: Marginal and Conditional Distributions are Normal
This is a profound property. It means that if you start with a set of variables that are jointly normal, any subset you look at will also be normal.
- Marginalization: If a vector is MVN, then the distribution of just (ignoring ) is also a (simpler) MVN. Visually, this is like projecting the high-dimensional bell shape onto a lower-dimensional axis.
- Conditioning: If you observe the value of a subset of variables (e.g., you know ), the distribution of the remaining variables () is still MVN, but with an updated mean and a smaller covariance. Visually, this is like taking a slice through the high-dimensional bell shape. This property is the mathematical foundation of Bayesian inference with Gaussian models.
A Visual Exploration of Gaussian Processes
The 'distill.pub' article explains these two operations very clearly. The formulas may look complex, but focus on the concept: you start with a Gaussian and you end with a Gaussian.
Read the section 'Marginalization and Conditioning'. Pay attention to the visual interpretations of 'integrating' (for marginals) and 'slicing' (for conditionals). The exact formulas are provided here and also in the 'A Guide on Data Analysis' resource (section 25.1.4.2), which you can use for reference.
Property 2: Linear Transformations are Normal
If is an MVN random vector and you apply a linear transformation to it (i.e., multiply by a matrix and add a vector ), the resulting vector is also MVN.
- Importance: This is crucial in many engineering and statistical models where one set of variables is a linear function of another. For example, if you model sensor noise as MVN and the system's dynamics are linear, you can precisely calculate the distribution of the system's state. It guarantees that normality is preserved through linear models. The
bookdown.orgresource, under section 25.1.4.1 Properties of the Multivariate Normal Distribution, provides the straightforward formulas for the new mean and covariance.
Property 3: Zero Correlation Implies Independence
In a previous lesson, we established that if two variables are independent, their covariance (and correlation) is zero. However, the reverse is generally not true... except for the MVN distribution.
For variables that are jointly normally distributed, zero correlation is a necessary and sufficient condition for independence.
- Importance: This is an enormous simplification. To check for independence between two normally distributed variables, you only need to check if their covariance is zero. This simplifies model structures and assumptions dramatically. For instance, if your covariance matrix is diagonal, you know that all your variables are mutually independent.
Let's hear a clear explanation of this and the linear transformation property.
Multivariate normal distributions
This clip from Jack Baker's video concisely explains the independence and linear transformation properties.
Watch the segment from 20:53 to 26:15. The first part covers why lack of correlation implies independence, and the second covers linear functions.
Conclusion
This lesson completes your tour of the fundamental probability distributions for machine learning. The Multivariate Normal distribution is a powerful tool for modeling continuous data in multiple dimensions.
Key Takeaways:
- The MVN is a generalization of the normal distribution, defined by a mean vector (its center) and a covariance matrix (its shape and orientation).
- The geometry of the MVN is an ellipsoid, whose principal axes are determined by the eigenvectors of and whose spread along those axes is determined by the eigenvalues.
- The MVN has powerful properties that make it mathematically tractable and useful for modeling:
- Its marginal and conditional distributions are also normal.
- It is closed under linear transformations.
- For MVN variables, zero correlation implies independence, which is a significant simplification.
- It serves as a foundational building block for many ML algorithms, including Gaussian Mixture Models, Linear Discriminant Analysis, Kalman Filters, and Gaussian Processes.
Next Steps:
Having covered the key distributions, our next module, "Statistical Inference and Estimation," will focus on a critical question: How do we determine the parameters of these distributions (like and ) from a set of observed data? We will begin by distinguishing between population parameters and sample statistics, and then dive into our first formal estimation technique: the Method of Moments.