Hello! Welcome to your fifth lesson in the "Probability and Distributions for Modeling Data" module.
In our last lesson, we explored the Normal and Exponential distributions for modeling continuous data. We noted how often the Normal (or Gaussian) distribution appears in real-world datasets and models, which might have left you wondering why it's so common. Today, we'll answer that question.
This lesson addresses the learning outcome: Apply the Central Limit Theorem to explain the prevalence of the normal distribution in sample means. We will unpack one of the most powerful and beautiful ideas in statistics—the Central Limit Theorem (CLT). Understanding the CLT is fundamental to your goal of mastering the "why" behind many statistical tests and machine learning techniques. It forms the theoretical bedrock for much of statistical inference.
1. The Core Idea: Order from Randomness
The Central Limit Theorem is a statement about what happens when you take the average of many random observations. In short, it says that regardless of the original population's distribution—be it uniform (like a die roll), exponential (like waiting times), or something completely unknown—the distribution of the sample means will tend to follow a Normal distribution as your sample size gets large enough.
This is a profound result. It implies that a predictable order (the bell curve) emerges from the aggregation of random events.
To build a strong intuition for this, let's watch a video from StatQuest. It demonstrates the CLT visually using different starting distributions.
The Central Limit Theorem, Clearly Explained!!!
This video from StatQuest with Josh Starmer provides a clear, visual explanation of the Central Limit Theorem.
Watch from the beginning to 04:39. Pay attention to how the histogram of the sample means gradually forms a bell shape, even when the original data comes from a uniform or an exponential distribution.
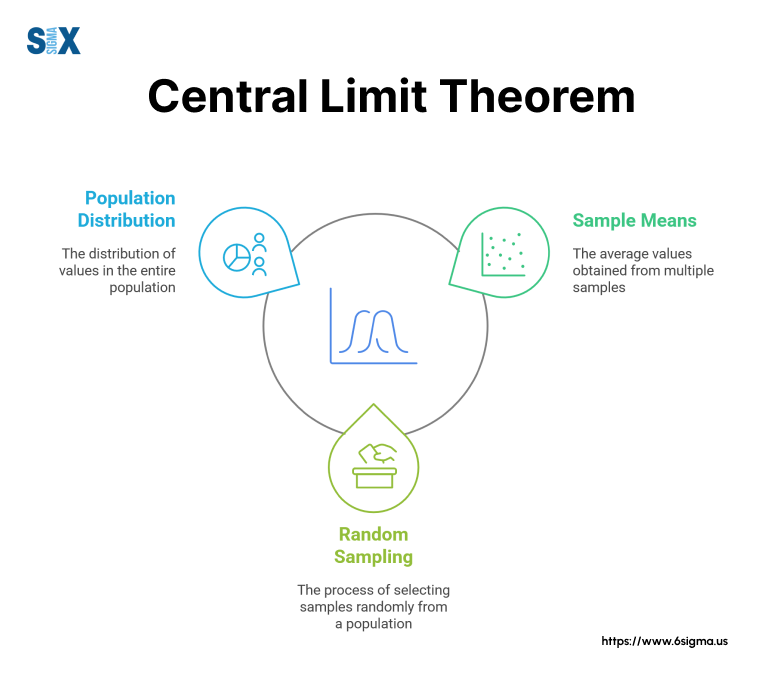
The process described in the video can be summarized in three steps, as illustrated below.
2. A Deeper Look: The Sum of Random Variables
The CLT is often explained in terms of sample means, but it's equally valid for the sum of random variables (since the mean is just the sum divided by the sample size, ). Thinking about sums can provide a more fundamental intuition.
Imagine rolling a single die. The outcome is a random variable from a uniform distribution. Now, what if you roll two dice and add their values? The sum is more likely to be 7 than 2 or 12. As you add more and more dice, the distribution of their sum starts to look more and more like a bell curve. Each die roll is an independent, random event, and their aggregation smooths out the randomness into a predictable, normal shape.
The following video from 3Blue1Brown offers a fantastic visual and mathematical intuition for this process.
But what is the Central Limit Theorem?
This video explores the CLT from the perspective of adding random variables together. It uses dice-rolling simulations to show how the bell curve emerges.
Watch the segments from 04:19 to 05:22 and 06:10 to 08:30. Focus on the core idea: as you increase the number of random variables in your sum (e.g., adding more dice), the distribution of the sum becomes more symmetric and bell-shaped, regardless of the initial distribution.
3. Key Properties and Assumptions
To apply the CLT correctly, we need to understand its properties and the conditions under which it holds.
a) The Sampling Distribution of the Mean
When we repeatedly take samples and calculate their means, the distribution of these means is called the sampling distribution of the mean. The CLT tells us this distribution has two key properties:
- Mean: The mean of the sampling distribution () is equal to the mean of the original population ().
- Standard Deviation: The standard deviation of the sampling distribution is called the standard error of the mean (). It is smaller than the population standard deviation () and is calculated as:
where is the sample size.
This formula is crucial. It shows that as our sample size increases, the standard error decreases. This means our sample means become more tightly clustered around the true population mean, making our estimate more precise. The Medium article "The Central Limit Theorem and its Role in Data Science" explains this well in the section titled "Variance Shrinks."
b) Necessary Assumptions
The CLT is powerful, but it's not magic. It relies on a few key assumptions about the data.
But what is the Central Limit Theorem?
The 3Blue1Brown video concludes by clearly outlining the three critical assumptions for the CLT. Understanding these is essential for applying the theorem correctly.
Watch the segment from 28:03 to 30:44. Make sure you understand the three assumptions mentioned.
To summarize, the key assumptions are:
- Independence: The observations in each sample must be independent of one another.
- Identical Distribution: All samples should be drawn from the same underlying population distribution. (These first two are often combined and referred to as i.i.d. for "independent and identically distributed").
- Finite Variance: The population distribution must have a finite variance. This is true for almost all distributions you will encounter in practice.
Test your understanding!
A data scientist is analyzing user engagement on a website. The distribution of time spent on the site per user is heavily skewed to the right (a few "power users" spend a lot of time, while most spend very little). The scientist wants to run a hypothesis test to see if a new website design increases the average time spent. This test assumes that the sample mean is normally distributed.
Can the scientist rely on the Central Limit Theorem to justify this assumption? Why or why not? What condition is most important here?
Show answer
Yes, the scientist can likely rely on the Central Limit Theorem. Even though the underlying population distribution of "time spent" is skewed, the CLT states that the distribution of the sample mean of time spent will be approximately normal.
The most important condition here is that the sample size is sufficiently large. A common rule of thumb is a sample size of , but this can vary. With a large enough sample of users, the sampling distribution of the average time spent will approximate a normal distribution, allowing the use of standard hypothesis tests (like a t-test or z-test).
4. Practical Applications in Data Science and ML
So, why is this theorem so vital for a machine learning engineer? Because it allows us to make inferences about populations using samples, which is the foundation of statistical testing and model evaluation.
For a great overview, I recommend reading the following resource.
A Gentle Introduction to the Central Limit Theorem for ...
The article 'A Gentle Introduction to the Central Limit Theorem for Machine Learning' by Jason Brownlee provides a concise summary of the CLT and its direct impact on machine learning practices.
Read the sections 'Central Limit Theorem' and 'Impact on Machine Learning'. Focus on how the CLT enables the use of significance tests and the construction of confidence intervals for model performance.
As the article mentions, here are two key areas where the CLT is applied:
-
Hypothesis Testing (e.g., A/B Testing): When comparing two models or two versions of a product (e.g., website layouts A and B), we look at a metric like the average click-through rate. The CLT allows us to assume the sample mean of this metric is normally distributed, which lets us calculate p-values and determine if the observed difference is statistically significant or just due to random chance.
-
Confidence Intervals: When we evaluate a model, we might get an accuracy of, say, 92% on our test set. But how confident are we in this number? Because of the CLT, we can treat this accuracy score as a sample mean from a distribution of possible scores. This allows us to calculate a confidence interval (e.g., "we are 95% confident that the true model accuracy is between 91% and 93%"), giving a much better sense of the model's real-world performance.
The Medium article "The Central Limit Theorem and its Role in Data Science" (ID: LINK) provides Python code for these applications under the headings "Confidence Intervals", "A/B Testing", and "Machine Learning Model Evaluation", which I encourage you to explore if you're interested in the implementation details.
Conclusion
Today, you've learned about the Central Limit Theorem, one of the most important concepts in statistics. It provides the crucial link between any population distribution and the predictable, normal distribution of its sample means.
Key Takeaways:
- The What: The CLT states that the sampling distribution of the sample mean will be approximately normal if the sample size is large enough, regardless of the population's original distribution.
- The Why: This happens because summing or averaging many independent random variables smooths out extremes and idiosyncrasies, leading to a symmetric, bell-shaped distribution.
- The How: The sampling distribution will have a mean equal to the population mean () and a standard deviation (standard error) of .
- The Importance: It is the theoretical justification for many statistical inference methods used in machine learning, such as hypothesis testing and constructing confidence intervals.
Next Steps:
So far in this module, we have focused on understanding and modeling single variables. However, in machine learning, we are almost always interested in the relationship between variables. In our next lesson, we will learn how to measure the strength and direction of the linear relationship between two variables using covariance and correlation.