Hello! Welcome to your sixth lesson in the "Probability and Distributions for Modeling Data" module.
In our last lesson on the Central Limit Theorem, we saw how a predictable order (the normal distribution) emerges when we look at the average of a single variable across many samples. This wrapped up our initial focus on analyzing variables one at a time (univariate analysis).
Today, we'll make a crucial transition. In machine learning, we're rarely interested in just one variable; we want to understand how different variables interact. This lesson begins our journey into bivariate analysis, where we study the relationship between two variables.
This lesson addresses the learning outcome: Calculate covariance and correlation to measure the linear relationship between two variables. We will explore how to quantify the direction and strength of these relationships, a fundamental step in many ML tasks like feature selection and exploratory data analysis.
1. From Variance to Covariance: Measuring Togetherness
You're already familiar with variance, which measures how much a single variable "varies" from its mean. But what if we have two variables, say, height and weight, and we want to know if they vary together? Does a higher-than-average height tend to correspond with a higher-than-average weight?
This is precisely the question that covariance answers. It measures the joint variability of two random variables.
To build an intuition for this, let's watch a short, conceptual video.
This video from Normalized Nerd provides an excellent visual explanation of why we need covariance and how it captures the trend between two variables.
Watch from 01:40 to 04:17. Focus on how the data points are divided into four quadrants based on the means of X and Y, and how the sign of the covariance depends on where most points lie.
As the video explained, the formula for the sample covariance is:
- If for a given data point, both and are above their respective means, the product will be positive.
- The same is true if both are below their means (negative times negative is positive).
- If one is above its mean and the other is below, the product will be negative.
Summing these products tells us the dominant trend:
- Positive Covariance: Indicates a positive linear relationship (as one variable increases, the other tends to increase).
- Negative Covariance: Indicates a negative linear relationship (as one variable increases, the other tends to decrease).
- Covariance near Zero: Indicates little to no linear relationship.
However, covariance has a major limitation: its magnitude is hard to interpret. For example, a covariance of 100 might be very strong for one dataset but weak for another, depending on the units and scale of the variables. This is where correlation comes in.
2. Correlation: Normalizing for Strength
Correlation is a standardized version of covariance. It gives us a measure of both the direction and the strength of the linear relationship, and its value is always between -1 and 1, making it easily interpretable.
The formula for the Pearson correlation coefficient () is:
where and are the sample standard deviations of X and Y, respectively. By dividing by the standard deviations, we effectively remove the scale dependency of the variables.
Here's a guide to interpreting the correlation coefficient:
- r = +1: Perfect positive linear relationship.
- r = -1: Perfect negative linear relationship.
- r = 0: No linear relationship.
- Values close to 1 or -1 indicate a strong linear relationship.
- Values close to 0 indicate a weak linear relationship.
The following image provides a great visual for what different correlation values look like.
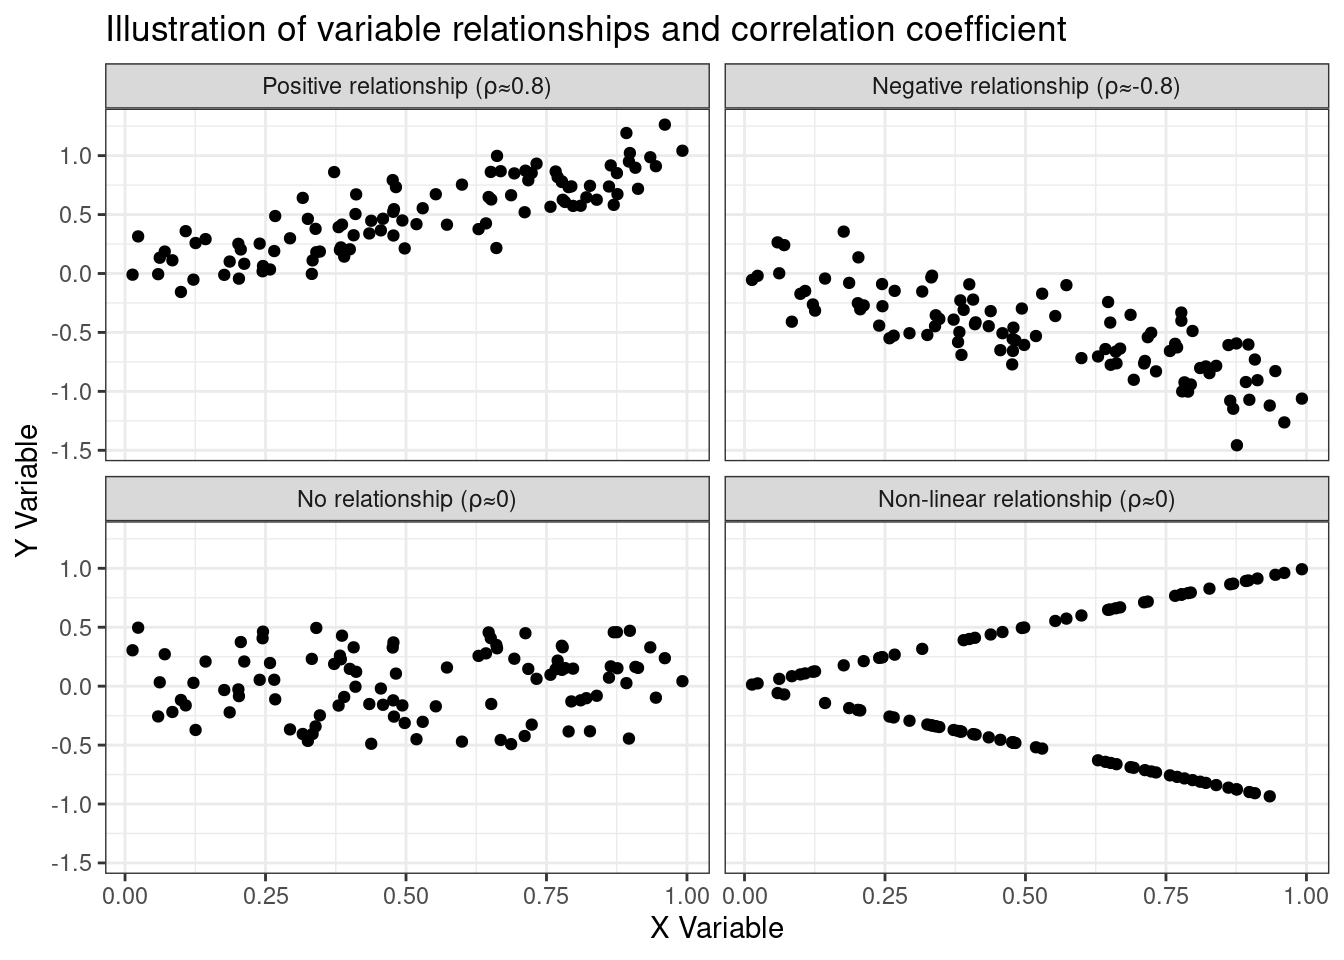
3. Calculating Covariance and Correlation
Now that we understand the concepts, let's walk through the actual calculation. While in practice you'll use software, working through an example by hand is the best way to solidify your understanding of the mechanics.
The following video demonstrates the step-by-step process for a small dataset.
How To Calculate The Correlation Coefficient Using The Covariance Formula - College Statistics
This video from The Organic Chemistry Tutor provides a clear, methodical walkthrough of calculating covariance and then using it to find the correlation coefficient.
Watch from 02:01 to 12:36. Follow along as the instructor calculates the means, the deviations from the mean for each point, the covariance, the standard deviations, and finally, the correlation coefficient. Don't worry about the second calculation method shown after this section for now.
Test your understanding!
Let's say you have a tiny dataset of two variables, X and Y:
- X = [1, 2, 6]
- Y = [6, 4, 2]
First, calculate the sample means, and . Then, calculate the sample covariance, . Based on the sign of the covariance, what is the direction of the relationship?
Show answer
-
Calculate means:
-
Calculate covariance:
- For point (1, 6):
- For point (2, 4):
- For point (6, 2):
- Sum of products =
The covariance is -5. Since it's negative, it indicates a negative linear relationship (as X increases, Y tends to decrease).
4. Key Considerations for Machine Learning
Understanding how to calculate correlation is the first step. For your goal of applying these concepts in machine learning, it's even more critical to understand its limitations and practical use.
Please read the following document for a consolidated summary and some worked examples.
Lesson 1: Covariance and Correlation
This document from the University of Waterloo provides a concise summary of covariance and correlation, along with practical examples that reinforce the calculations and interpretation.
Read the sections on 'Covariance', 'The Pearson Correlation Coefficient', 'Example 1', and 'Causation'. Pay attention to how the results are interpreted in the context of the problem.
The resources so far have highlighted two crucial points that every data scientist must remember.
a) Correlation Measures Linear Relationships Only
A correlation coefficient of zero does not mean there is no relationship between the variables; it just means there is no linear relationship. The bottom-right panel of the scatter plot image above shows a perfect quadratic relationship, but its linear correlation is zero. This is a common pitfall. Always visualize your data with a scatter plot before drawing conclusions from a correlation value.
b) Correlation is NOT Causation
This is perhaps the most important maxim in statistics. A strong correlation between two variables does not prove that one causes the other. There could be a third, unobserved variable (a confounding variable) that is influencing both. The reading mentioned the classic example of storks and birth rates being correlated because both are more common in rural areas (the confounding variable).
For a deeper dive into these nuances and to see how to perform these calculations in Python, the primary tool for ML, please review the following article.
Day 31 — Covariance and Correlation in Machine Learning
This article from Medium provides Python code for calculating covariance and correlation and gives excellent explanations for the concepts of 'zero correlation vs. independence' and 'correlation vs. causation'.
Focus on three parts: 'Practical Examples' to see how to use NumPy to get a correlation matrix, 'Correlation and Independence' to understand the non-linear relationship caveat, and 'Correlation and Causation' for a great simulation of a confounding variable.
As the article shows, you can easily compute the correlation between two variables, X and Y, in Python using NumPy:
import numpy as np

# A matrix is returned, where the off-diagonal elements [0,1] and [1,0]
# contain the correlation coefficient between X and Y.
corr_matrix = np.corrcoef(X, Y)
correlation = corr_matrix[0, 1]
This is the approach you will most often use in practice when exploring a new dataset.
Conclusion
In this lesson, we moved from single-variable analysis to understanding the relationship between two variables. You learned how to quantify this relationship using covariance and correlation, both conceptually and computationally.
Key Takeaways:
- Covariance measures the direction of a linear relationship. Its magnitude is scale-dependent and difficult to interpret.
- Correlation is a normalized version of covariance that measures both the strength and direction of a linear relationship. Its value is always between -1 and 1.
- A correlation of 0 implies no linear relationship, but a non-linear relationship might still exist. Always visualize your data.
- A strong correlation between two variables does not mean one causes the other. Correlation is not causation.
Next Steps:
Today, we looked at the relationship between two variables. In machine learning, datasets almost always contain many more than two features. Our next lesson will generalize today's concepts to the multivariate case. We will learn how to construct and interpret a covariance matrix, a powerful tool for understanding the relationships across all pairs of variables in a dataset at once.