Hello! Welcome back to our course.
In our last lesson, we successfully wrote Python code to detect Fair Value Gaps (FVGs) and store them in a pandas DataFrame. We've taught our script to find these market inefficiencies, but raw data in a table is difficult to use for real-world analysis.
Today, we'll bridge that gap. This lesson is all about bringing your data to life, directly addressing our learning outcome: to visualize detected FVGs on a price chart using your script. By the end of this session, you'll be able to create interactive charts that clearly highlight FVG zones, turning your algorithm's output into a powerful tool for visual analysis—a critical skill for both discretionary trading and verifying your future trading bots.
1. The Goal: From Data to Visuals
Our objective is to take the FVG data we generated—the bullish or bearish type, and the high/low price levels—and draw it on a candlestick chart. We don't just want to mark the spot where the FVG formed; we want to draw a colored, semi-transparent rectangle that extends into the future. This allows us to see how price interacts with that zone later on, which is the entire point of identifying FVGs in the first place.
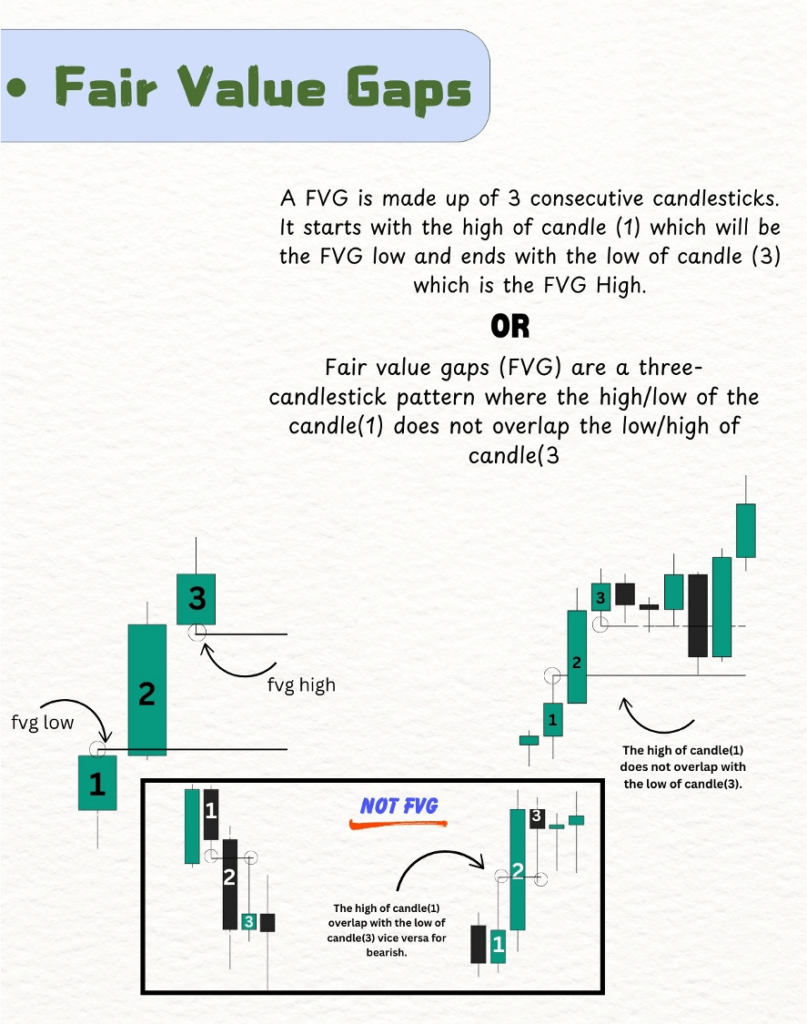
2. Choosing Our Tool: Plotly for Interactive Charts
For financial charting, we need a library that can create interactive plots that allow zooming, panning, and hovering to inspect data points. While libraries like Matplotlib are powerful, Plotly is exceptionally well-suited for this task. It's designed for creating rich, web-based, and interactive visualizations, making it a perfect choice for traders and analysts.
We will use the plotly.graph_objects module, which gives us fine-grained control over our chart's components.
3. Implementing the FVG Visualization
The core logic involves three steps:
- Create a basic candlestick chart.
- Iterate through our DataFrame and find every row where an FVG was detected.
- For each FVG, draw a corresponding rectangle shape on the chart, setting its color based on whether it's bullish or bearish.
The following video provides an excellent demonstration of this exact process.
Automate Fair Value Gap Detection in Python for Algorithmic Trading
The video 'Automate Fair Value Gap Detection in Python' from the CodeTrading channel clearly shows the end result we're aiming for and gives a brief overview of the code.
Please watch from 08:28 to 09:46. Pay close attention to how the colored rectangles represent the FVGs and are extended to the right to see future price interaction. This is the visualization we are about to build.
Now, let's write the code to replicate this. The key is using Plotly's add_shape() method. This function allows us to draw various shapes, including rectangles (type="rect"), on our chart.
We need to provide it with a few key pieces of information for each FVG:
- Coordinates: The x-axis (time) and y-axis (price) boundaries of the rectangle.
x0,x1: The start and end dates/times for the rectangle.y0,y1: The start and end prices for the rectangle (the FVG's boundaries).
- Styling:
fillcolor: The color of the zone (e.g., green for bullish, red for bearish).opacity: A value between 0 and 1 to make the rectangle semi-transparent, so we can still see the candles behind it.
- Layering:
layer='below': This is a crucial parameter that ensures our FVG zones are drawn behind the candlestick price data, not on top of them.
4. Putting It All Together: A Complete Script
Here is a complete Python script that fetches data, uses the detect_fvg function from our last lesson, and then plots the results using Plotly.
For clarity and self-containment, the detect_fvg function is included again here.
import pandas as pd
import yfinance as yf
import plotly.graph_objects as go

# --- Step 1: FVG Detection Function (from previous lesson) ---
def detect_fvg(data: pd.DataFrame, lookback_period: int = 10, body_multiplier: float = 1.0):
    """Detects Fair Value Gaps (FVGs) in historical price data."""
    fvg_list = [None, None]
    for i in range(2, len(data)):
        first_high = data['High'].iloc[i-2]
        first_low = data['Low'].iloc[i-2]
        middle_open = data['Open'].iloc[i-1]
        middle_close = data['Close'].iloc[i-1]
        third_high = data['High'].iloc[i]
        third_low = data['Low'].iloc[i]

        prev_bodies = abs(data['Close'].iloc[max(0, i-1-lookback_period):i-1] -
                          data['Open'].iloc[max(0, i-1-lookback_period):i-1])
        avg_body_size = prev_bodies.mean()
        if avg_body_size == 0: avg_body_size = 0.00001
        middle_body = abs(middle_close - middle_open)

        is_bullish_fvg = (third_low > first_high) and (middle_body > avg_body_size * body_multiplier)
        is_bearish_fvg = (third_high < first_low) and (middle_body > avg_body_size * body_multiplier)

        if is_bullish_fvg:
            # Tuple: (type, bottom_of_gap, top_of_gap, index_of_3rd_candle)
            fvg_list.append(('bullish', first_high, third_low, i))
        elif is_bearish_fvg:
            # Tuple: (type, top_of_gap, bottom_of_gap, index_of_3rd_candle)
            fvg_list.append(('bearish', third_high, first_low, i))
        else:
            fvg_list.append(None)
    return fvg_list

# --- Step 2: Fetch Data and Detect FVGs ---
df = yf.download('EURUSD=X', period='60d', interval='4h')
df['fvg'] = detect_fvg(df)

# --- Step 3: Visualize the Data with Plotly ---
# Create a Plotly figure
fig = go.Figure()

# Add the candlestick trace
fig.add_trace(go.Candlestick(x=df.index,
                             open=df['Open'],
                             high=df['High'],
                             low=df['Low'],
                             close=df['Close'],
                             name='EURUSD'))

# Add FVG shapes to the figure
for i, fvg_data in enumerate(df['fvg']):
    if fvg_data is not None:
        fvg_type, fvg_low, fvg_high, fvg_index = fvg_data

        # Define rectangle coordinates
        x0 = df.index[fvg_index]
        x1 = df.index[min(fvg_index + 30, len(df) - 1)] # Extend 30 bars or to the end
        y0 = fvg_low
        y1 = fvg_high

        # Define color based on FVG type
        color = "rgba(0, 255, 0, 0.2)" if fvg_type == 'bullish' else "rgba(255, 0, 0, 0.2)"

        fig.add_shape(
            type="rect",
            x0=x0, y0=y0, x1=x1, y1=y1,
            line=dict(color="rgba(0,0,0,0)"), # No border line
            fillcolor=color,
            layer='below' # Draw behind the candles
        )

# Update layout for a clean look
fig.update_layout(
    title='EURUSD 4H Chart with Fair Value Gaps (FVG)',
    xaxis_title='Date',
    yaxis_title='Price',
    xaxis_rangeslider_visible=False # Hide the range slider
)

# Show the figure
fig.show()
When you run this script, an interactive chart will open in your web browser. You'll see the candlestick chart with green and red boxes highlighting the bullish and bearish FVGs, extended forward in time so you can analyze their impact.
The following article walks through this same visualization logic, reinforcing how to translate the detected gaps into plotted shapes.
Automating Fair Value Gaps (FVG) in Python
The article 'Automating Fair Value Gaps (FVG) in Python' by Ziad Francis also provides a clear, code-based explanation for plotting with Plotly.
Please read the final section titled 'Visualizing FVG on the price chart'. It explains the process of iterating through the detected gaps and drawing a rectangle shape for each one on a Plotly chart, just as we did in our script.
Test your understanding!
In the plotting script above, find the line that extends the FVG box to the right:x1 = df.index[min(fvg_index + 30, len(df) - 1)]
How would you modify this line to make the FVG zones extend for 50 bars instead of 30?
Show answer
You would change the number 30 to 50. The modified line would be:
x1 = df.index[min(fvg_index + 50, len(df) - 1)]
This simple change demonstrates how you can easily configure the visualization to suit your analytical needs. The min() function is there to prevent an error if the extension goes past the end of your available data.
Conclusion
Congratulations! You have now closed the loop from data detection to visual analysis. This is a massive step forward in your journey to building trading bots. You can now not only find ICT patterns programmatically but also see them on a chart to verify your logic and analyze their behavior.
Key Takeaways:
- Plotly is an excellent library for creating interactive financial charts.
- The
fig.add_shape(type="rect", ...)method is used to draw zones like FVGs on a chart. - The
layer='below'parameter is essential for drawing shapes behind the main price data. - Using
rgbacolor values (e.g.,"rgba(0, 255, 0, 0.2)") allows you to set both the color and itsopacityfor a see-through effect. - Extending the FVG zone into the future (
x1) is key to analyzing how price interacts with it over time.
Preview for the Next Lesson:
We can now identify and visualize market imbalances (FVGs). However, the location of an FVG is just as important as its existence. A high-quality setup often involves an FVG that forms in a specific part of a larger price move. In our next lesson, we will learn how to programmatically identify the premium and discount zones of a given price range. This will allow us to filter for FVGs that appear in optimal locations, dramatically improving the quality of our potential trade signals.