Hello and welcome back to our module on "Automating Core ICT Concepts."
In our previous lessons, we built a solid foundation by teaching our script to identify market structure: Break of Structure (BOS) for trend continuation and Change of Character (ChoCH) for potential reversals. These concepts are about the direction of price.
Today, we shift our focus from direction to efficiency. We'll explore a core ICT concept that highlights imbalances in price delivery. This brings us to our learning outcome: to write Python logic to detect Fair Value Gaps (FVGs) from OHLC data. FVGs, also known as imbalances, are like magnets for price and are critical for identifying high-probability areas for entries and targets in your trading strategies.
1. What is a Fair Value Gap (FVG)?
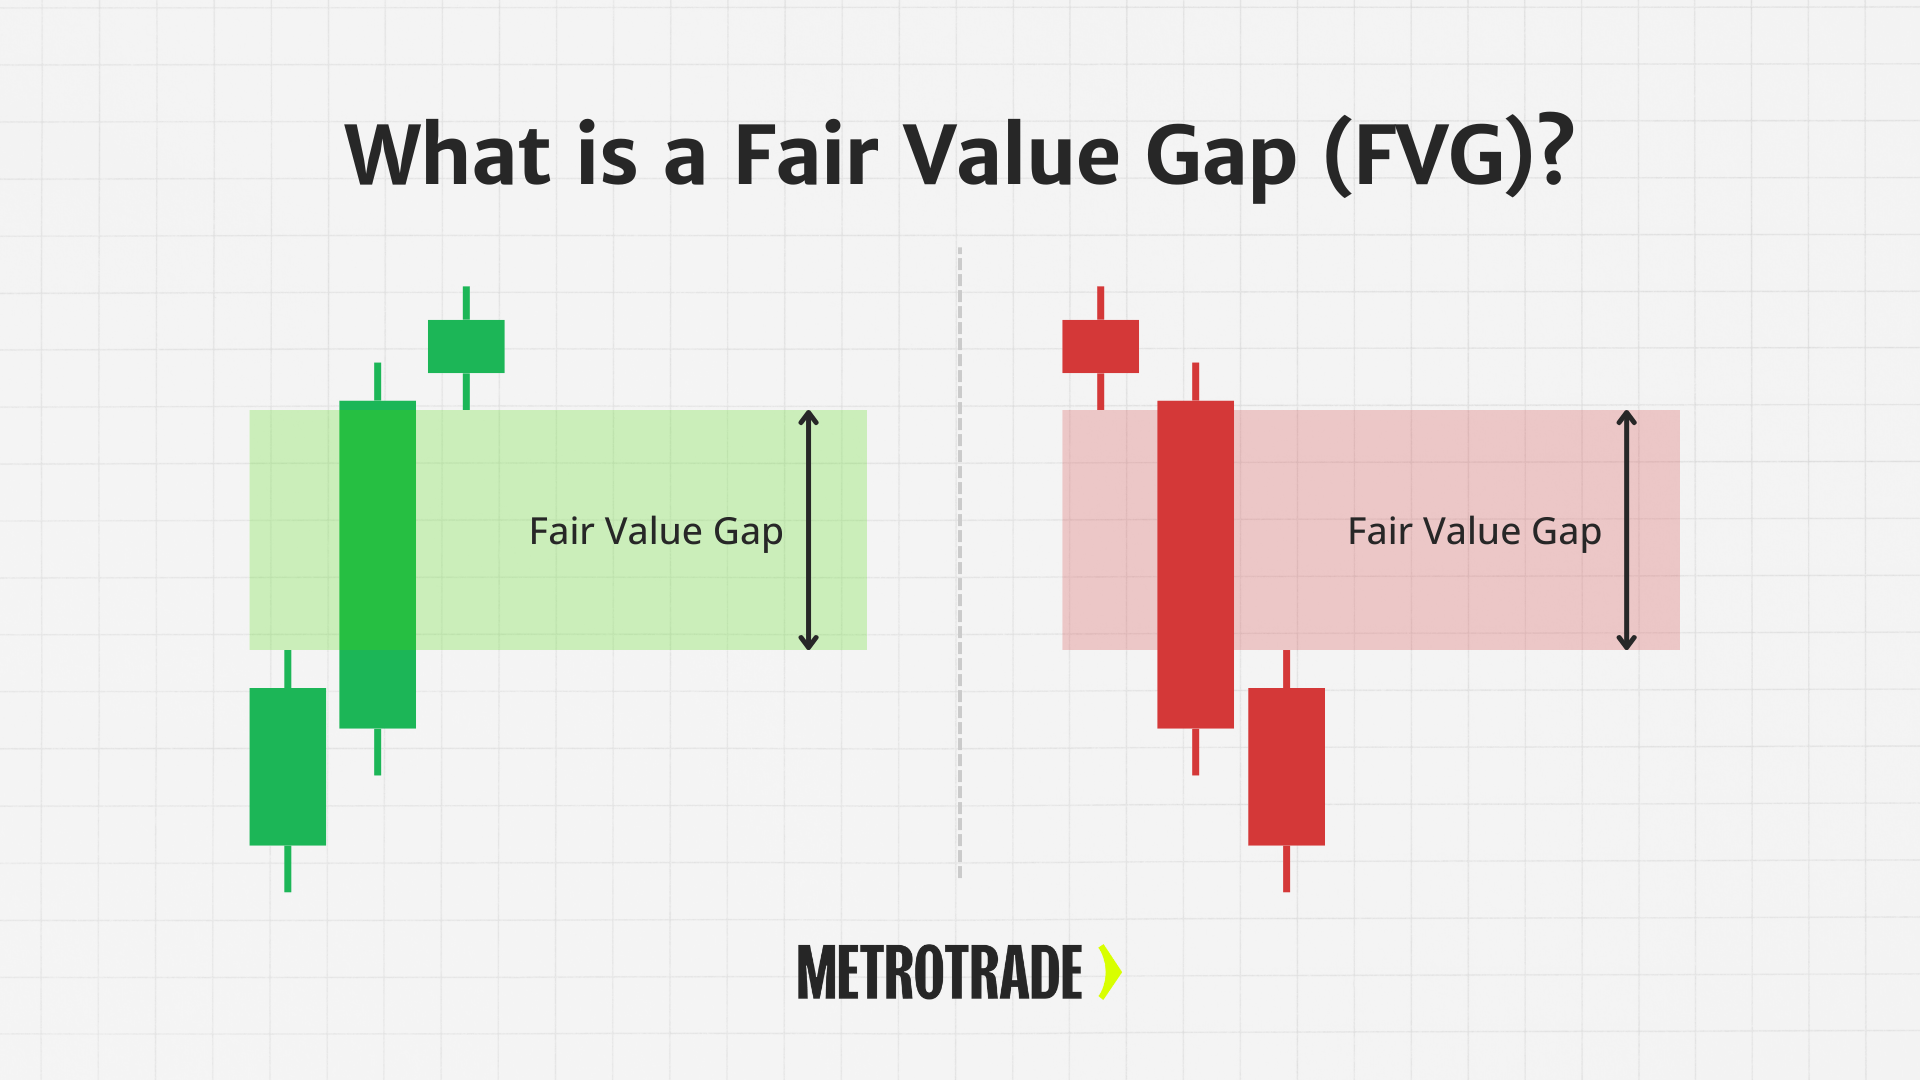
A Fair Value Gap represents an inefficiency in the market. It's a three-candle pattern where price moves so quickly and aggressively in one direction that it leaves a "gap" between the wicks of the first and third candles.
Let's look at a visual definition:
The rules are very specific:
- A Bullish FVG forms when the low of the third candle is above the high of the first candle. This signals a strong upward momentum.
- A Bearish FVG forms when the high of the third candle is below the low of the first candle. This signals strong downward momentum.
The middle candle is the powerful "displacement" candle that creates the imbalance.

For a concise summary of the concept and the institutional logic behind it, the following article is a great starting point.
Automating Fair Value Gaps (FVG) in Python
The article 'Automating Fair Value Gaps (FVG) in Python' by Ziad Francis provides a clear explanation of what an FVG is and why it matters to traders.
Please read the first section titled 'What Defines a Fair Value Gap…Briefly'. Focus on the three-candle structure and the explanation of why these gaps are seen as 'institutional footprints'.
The core idea is that these gaps represent areas where price moved too fast for the market to be fully efficient. ICT theory suggests that price will often revisit these areas to "rebalance" or "mitigate" the inefficiency before continuing its move.
2. From Concept to Algorithm
Now, let's break down the FVG definition into a step-by-step process that we can code. Our algorithm will need to:
- Iterate through our OHLC data, looking at a rolling window of three consecutive candles.
- For each set of three candles (let's call their index positions
i-2,i-1, andi), we need to grab the relevant price points:- The high and low of the first candle (
High[i-2],Low[i-2]). - The high and low of the third candle (
High[i],Low[i]).
- The high and low of the first candle (
- Apply the FVG rules:
- To detect a Bullish FVG: Check if
Low[i] > High[i-2]. - To detect a Bearish FVG: Check if
High[i] < Low[i-2].
- To detect a Bullish FVG: Check if
However, this simple logic can produce many signals, including very small, insignificant gaps. To refine our detector, we can add a filter to ensure the FVG was created by a strong, impulsive move. A common way to do this is to check the size of the middle candle's body.
Refined Logic: An FVG is only valid if the body of the middle candle (candle i-1) is significantly larger than the average candle body size over a recent period.
3. Implementing FVG Detection in Python
Now we'll translate this logic into a Python function. The following video provides an excellent walkthrough of creating a robust FVG detector from scratch, including the significance filter we just discussed.
Automate Fair Value Gap Detection in Python for Algorithmic Trading
The video 'Automate Fair Value Gap Detection in Python' from the CodeTrading channel details the Python code needed to find FVGs in a pandas DataFrame.
Please watch from 02:23 to 08:28. The first part (until 07:15) explains the function's logic line by line, including how it extracts candle data and applies the filter for the middle candle's body size. The second part shows how to call the function and inspect the results in the DataFrame.
Based on the logic from the video, here is a Python function that accomplishes our goal. It takes a pandas DataFrame with OHLC data and identifies FVGs.
import pandas as pd
import yfinance as yf

def detect_fvg(data: pd.DataFrame, lookback_period: int = 10, body_multiplier: float = 1.0):
    """
    Detects Fair Value Gaps (FVGs) in historical price data.

    Args:
        data (pd.DataFrame): DataFrame with columns ['Open', 'High', 'Low', 'Close'].
        lookback_period (int): Number of candles to check for average body size.
        body_multiplier (float): Multiplier to determine a significant middle candle.

    Returns:
        A list containing FVG info tuples or None.
    """
    fvg_list = [None, None]  # Can't be an FVG on the first two candles

    for i in range(2, len(data)):
        # --- 1. Extract OHLC for the 3-candle window ---
        first_high = data['High'].iloc[i-2]
        first_low = data['Low'].iloc[i-2]

        middle_open = data['Open'].iloc[i-1]
        middle_close = data['Close'].iloc[i-1]

        third_high = data['High'].iloc[i]
        third_low = data['Low'].iloc[i]

        # --- 2. Implement the significance filter ---
        # Calculate the average absolute body size over the lookback period
        prev_bodies = abs(data['Close'].iloc[max(0, i-1-lookback_period):i-1] -
                          data['Open'].iloc[max(0, i-1-lookback_period):i-1])
        avg_body_size = prev_bodies.mean()

        # Ensure avg_body_size is not zero
        if avg_body_size == 0:
            avg_body_size = 0.00001 # A small non-zero number

        middle_body = abs(middle_close - middle_open)

        # --- 3. Check for Bullish and Bearish FVG conditions ---
        is_bullish_fvg = (third_low > first_high) and (middle_body > avg_body_size * body_multiplier)
        is_bearish_fvg = (third_high < first_low) and (middle_body > avg_body_size * body_multiplier)

        if is_bullish_fvg:
            # Tuple: (type, top_of_gap, bottom_of_gap, index_of_3rd_candle)
            fvg_list.append(('bullish', third_low, first_high, i))
        elif is_bearish_fvg:
            fvg_list.append(('bearish', first_low, third_high, i))
        else:
            fvg_list.append(None)

    return fvg_list

# --- Example Usage ---
# 1. Fetch data
df = yf.download('EURUSD=X', period='30d', interval='1h')

# 2. Detect FVGs
fvg_signals = detect_fvg(df)

# 3. Add the signals to our DataFrame
df['fvg'] = fvg_signals

# 4. Display rows where an FVG was detected
print("FVGs Detected:")
print(df[df['fvg'].notna()])
When you run this code, you'll see a new fvg column. On rows where the third candle of an FVG pattern completes, this column will contain a tuple with all the necessary information: its type (bullish or bearish), its price boundaries, and its index. This structured data is exactly what you need for building an automated strategy.
Test your understanding!
You have three consecutive candles with the following data:
- Candle 1: High = 1.0750, Low = 1.0730
- Candle 2: Open = 1.0760, Close = 1.0790
- Candle 3: High = 1.0800, Low = 1.0755
Assuming the middle candle's body size is significant, would this pattern form a Fair Value Gap? If so, what type?
Show answer
Yes, this would form a bullish Fair Value Gap.
The condition for a bullish FVG is that the low of candle 3 must be higher than the high of candle 1.
Here, Candle 3 Low (1.0755) is greater than Candle 1 High (1.0750). The gap exists between 1.0750 and 1.0755.
4. The Efficient Path: Using the smartmoneyconcepts Library
Now that you've built an FVG detector from scratch and understand the logic, you can appreciate the convenience of using a pre-built library. The smartmoneyconcepts package that we used for BOS and ChoCH also has a function for detecting FVGs.
The PyPI documentation for smartmoneyconcepts shows how to use its built-in FVG function.
Scroll to the 'Indicators' section and find the heading for 'Fair Value Gap (FVG)'. Note the simple definition and the parameters and values returned by the function.
Using the library streamlines our code significantly.
from smartmoneyconcepts import smc

# The library expects lowercase column names
df_smc = df.copy()
df_smc.columns = [col.lower() for col in df_smc.columns]

# The smc.fvg() function returns a DataFrame with FVG information
fvg_df = smc.fvg(df_smc)

# Let's inspect the results
# The library creates columns indicating the FVG, its levels, and mitigation status
print("\nFVGs Detected by smartmoneyconcepts library:")
print(fvg_df[fvg_df['FVG'] != 0])
As you can see, the library handles the iteration and condition-checking for you. Building the function yourself was a crucial learning step, but for developing your trading bots, using a reliable library like this will save you a lot of time and effort.
Conclusion
Great job today! You have successfully translated another key ICT concept into Python code. You can now programmatically identify areas of market inefficiency, which are vital for pinpointing potential trading opportunities.
Key Takeaways:
- A Fair Value Gap (FVG) is a three-candle pattern that signals an imbalance in price delivery.
- The core rule is that the wicks of the first and third candles do not overlap.
- A Bullish FVG is formed when
Candle 3 Low > Candle 1 High. - A Bearish FVG is formed when
Candle 3 High < Candle 1 Low. - To create a more robust detector, you can filter for FVGs created by a strong momentum candle (one with a large body).
- You can implement this logic from scratch to fully understand it, or use a library like
smartmoneyconceptsfor efficiency.
Preview for the Next Lesson:
We've successfully written the logic to find FVGs and store them in our DataFrame. But data in a table is hard to interpret. In our next lesson, we will bring this data to life. We will learn how to visualize detected FVGs on a price chart using your script, turning our raw data into a powerful analytical tool that you can interpret at a glance.