Welcome to the final lesson of our first module on Market Structure and Liquidity!
So far, we've built a strong foundation. You've learned to identify market structure, map it across timeframes, and pinpoint the crucial pools of buy-side (BSL) and sell-side (SSL) liquidity. In the last lesson, we focused on what happens at these levels, recognizing liquidity sweeps and stop hunts.
Now, we'll put all the pieces together. Today's lesson will teach you how to anticipate price movement towards significant liquidity pools. This concept, known in ICT as the Draw on Liquidity (DOL), is the key to establishing a directional bias. Instead of just reacting to price, you will learn to forecast where the market is likely headed, allowing you to position yourself ahead of major moves.
1. The Draw on Liquidity: The Market's Destination
Think of the market as an algorithm with a perpetual mission: to seek liquidity. The "Draw on Liquidity" is simply its next, most logical destination. If you can determine where the market is being drawn, you can align your trades with the institutional order flow.
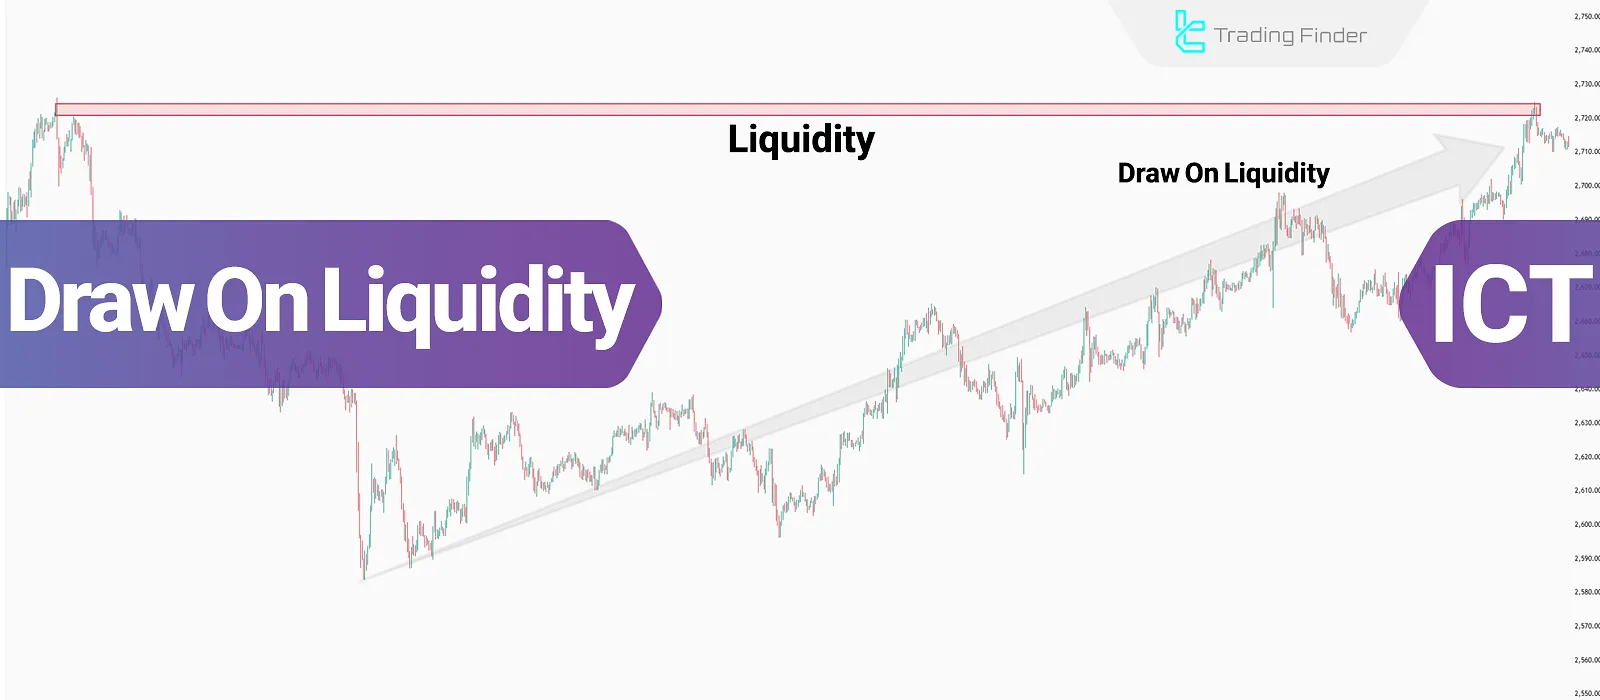
The market algorithm seeks two primary types of liquidity:
- External Range Liquidity: This is the liquidity resting at the boundaries of a price range, which you know as buy-side (BSL) and sell-side (SSL) liquidity. These are typically old swing highs and lows or relative equal highs and lows.
- Internal Range Liquidity: This refers to price inefficiencies within a range. In the upcoming module, we'll cover these in-depth, but for now, know that they include concepts like Fair Value Gaps (FVGs) and Order Blocks (OBs). The market often returns to these internal zones to "rebalance" price before continuing its journey to external liquidity.
To get a concise overview of these concepts, let's watch the first part of the following video.
Draw on Liquidity (DOL) - ICT Concepts
The video 'Draw on Liquidity (DOL) - ICT Concepts' by TTrades provides a clear introduction to what DOL is and the different types of liquidity the market targets.
Watch from the beginning to 01:24. Focus on the distinction between external liquidity (old highs/lows) and internal liquidity (Fair Value Gaps, Order Blocks).
The algorithm generally moves between these two types. For example, after sweeping an external low (SSL), it might rally to fill an internal FVG before continuing its move toward an external high (BSL). Your job is to figure out which target is next on the list.
2. The Institutional Compass: Reading Price Delivery Arrays
So, how do we determine the draw? We do this by observing how price interacts with key levels, which ICT collectively calls Price Delivery (PD) Arrays. For this lesson, we will focus primarily on Fair Value Gaps (FVGs) as key PD Arrays.
The market’s reaction to these zones acts as a compass, telling us its intention.
- Respecting a PD Array: When price enters a PD array and is sharply rejected, it validates that level. For example, if price drops into a bullish FVG and quickly moves higher, it confirms bullish intent. The DOL is likely the next pool of buy-side liquidity above.
- Disrespecting a PD Array: When price slices through a PD array with little to no reaction, it invalidates that level. For instance, if price rallies up to a bearish FVG and continues right through it, it tells you the bearish narrative is weak or wrong. This invalidation is a powerful clue that the DOL is higher.
This concept of validation and invalidation is the cornerstone of determining the DOL. The following video explains this framework brilliantly.
How to Find the Draw on Liquidity EASILY! (DOL) - ICT Concepts
The video 'How to Find the Draw on Liquidity EASILY!' by Justin Werlein explains the most practical way to determine the DOL: by observing whether PD Arrays are being respected or disrespected.
Watch from 01:22 to 05:39. Pay close attention to the logic: 'I am bearish UNTIL a bearish PD array is disrespected.' This simple but profound rule helps you stay on the right side of the market and know when to flip your bias.
3. Using Multi-Timeframe Analysis to Confirm the DOL
A single timeframe can be misleading. To build a high-probability directional bias, you must align the DOL across multiple timeframes using a top-down approach.
- High Timeframe (HTF) - Daily, 4H: Start here to identify the major, overarching draw. Is price targeting a weekly high? Is it reacting to a large daily FVG? This sets your long-term directional bias.
- Medium Timeframe (MTF) - 1H, 15M: Zoom in to find the more immediate DOL. Where are the nearest significant highs/lows or imbalances on these timeframes? Your goal is to see if the MTF narrative aligns with the HTF bias.
- Low Timeframe (LTF) - 5M, 1M: This is for execution. Once price reaches a HTF or MTF level of interest, you watch for confirmation on the LTF, such as a market structure shift, that signals price is now ready to move towards the DOL you've identified.
The next video demonstrates this multi-timeframe analysis in a real trade example.
Draw on Liquidity (DOL) - ICT Concepts
Let's return to the TTrades video to see a practical example of a top-down analysis for determining the Draw on Liquidity.
Watch from 05:45 to 08:05. Notice how the analysis starts on the Daily chart to find the HTF draw (a daily FVG) and then drills down through the 4H, 1H, 15M, and finally the 1M chart for an entry. This is the exact process you should aim to replicate.
4. Putting It All Together: A Walkthrough
Let's synthesize what we've learned into a step-by-step process.
Scenario: The market has been trending up. Price then pulls back.
- Identify HTF Context: You look at the 4H chart and see price is pulling back into a clear bullish FVG (a PD array in a discount). Your hypothesis is: "If this FVG is respected, the DOL will be the old 4H swing high (BSL)."
- Observe the Reaction: Price enters the 4H FVG. You drop to a 15M chart to watch the reaction. You see price stalls, and then a large bullish candle forms, creating a 15M market structure shift to the upside. This is respect for the 4H FVG.
- Confirm the DOL: The bullish reaction confirms your hypothesis. The market is now very likely targeting the 4H swing high as its primary Draw on Liquidity.
- Execute: You can now look for a low-risk long entry on a 1M or 5M chart, knowing that the institutional flow is on your side, aiming for that higher target.
Now, consider an alternative scenario. What if price had sliced straight through that 4H bullish FVG? That would be disrespect. It invalidates the bullish thesis, and you would immediately flip your bias to bearish, anticipating a move towards the next significant sell-side liquidity pool below.
Test your understanding!
Look at the chart below. Price has just aggressively broken through the blue-shaded area, which was a bearish Fair Value Gap.
Chart showing price disrespecting a bearish Fair Value Gap (blue box) and breaking above a recent high.
- Did price respect or disrespect the bearish PD array?
- Based on this price action, what is the most likely Draw on Liquidity now?
- How does this action change your directional bias?
Show answer
- Price clearly disrespected the bearish Fair Value Gap by moving through it with momentum and closing above it.
- The most likely Draw on Liquidity is now the next significant pool of buy-side liquidity, which in this case is the "Recent Swing High (BSL)" labeled on the chart.
- Any bearish bias should be invalidated. The disrespect for the bearish PD array signals strong bullish intent. The bias should flip from bearish/neutral to bullish, with the expectation that price will continue higher to attack the identified BSL.
From Mind to Machine: Automating DOL Analysis
Your goal of building trading bots makes this concept particularly powerful. The logic you've just learned is highly programmable:
- Step 1: Identify PD Arrays. A script can be written to detect FVGs or Order Blocks on a chart based on candlestick patterns.
- Step 2: Monitor Price Interaction. The algorithm can monitor if/when price enters the coordinates of a detected PD array.
- Step 3: Define "Respect" vs. "Disrespect". You can program rules for what constitutes a valid reaction. For example:
- Respect: Price enters an FVG and then closes outside of it in the opposite direction within N candles.
- Disrespect: Price closes completely through an FVG.
- Step 4: Set the DOL. Based on the outcome of Step 3, the algorithm can set its "target" variable to the coordinates of the nearest relevant BSL or SSL.
This is how you translate the nuanced art of chart reading into the precise science of an algorithm.
Conclusion
This lesson completes our journey through the foundational concepts of market structure and liquidity. You now have a complete framework for analyzing price, from identifying the trend to anticipating its next move.
Key Takeaways:
- The Draw on Liquidity (DOL) is the market's next logical target, either external (highs/lows) or internal (imbalances).
- Anticipate the DOL by observing if price respects or disrespects key PD Arrays like Fair Value Gaps and Order Blocks.
- Disrespecting a PD array is a powerful signal to flip your bias.
- Always use a top-down, multi-timeframe analysis to build a high-conviction view of the DOL.
Preview for the Next Module:
We've laid the groundwork. You now understand that the market seeks out imbalances and reacts to them. In our next module, "Price Imbalances: The Institutional Footprint," we will dive deep into what these imbalances are. You'll learn to precisely identify, define, and differentiate between high and low-probability Order Blocks and Fair Value Gaps—the very building blocks you'll use to pinpoint your entries and frame your trades.