Hello! Let's dive into the next piece of the puzzle.
In our last lesson, we learned how to spot the "fuel" for market moves by identifying buy-side (BSL) and sell-side (SSL) liquidity pools. You now know that these are not just random highs and lows, but areas where a significant number of orders accumulate, making them magnets for price.
Today, we'll focus on the moment of impact: what happens when price reaches these liquidity pools. This lesson is dedicated to helping you recognize liquidity sweeps (also known as stop hunts) on a price chart. This is a classic manipulation pattern used by institutional traders. Mastering its recognition will help you avoid common traps and, eventually, use it as a powerful component of your trade setups.
1. What is a Liquidity Sweep (or Stop Hunt)?
You've probably experienced this before: you enter a trade, place your stop loss at what seems like a safe and logical level, only to watch the price dip down, hit your stop, and then immediately reverse and head in your originally predicted direction. This frustrating experience is often the result of a liquidity sweep or stop hunt.
A liquidity sweep is a sharp, rapid price movement that pushes just beyond an obvious swing high or low, triggering the cluster of stop-loss and breakout orders resting there. Immediately after "sweeping" that liquidity, the price reverses.
- To engineer a move down: Institutions need to sell massive positions. To do so without crashing the price against themselves, they need a huge number of buyers. They create this by pushing price just above an old high (BSL), triggering buy-stops from short-sellers and attracting eager breakout buyers. The institutions then sell their large positions into this engineered buying frenzy.
- To engineer a move up: The logic is reversed. They push price just below an old low (SSL) to trigger sell-stops, creating a flood of sell orders that they can use to fill their large buy positions at a discount.
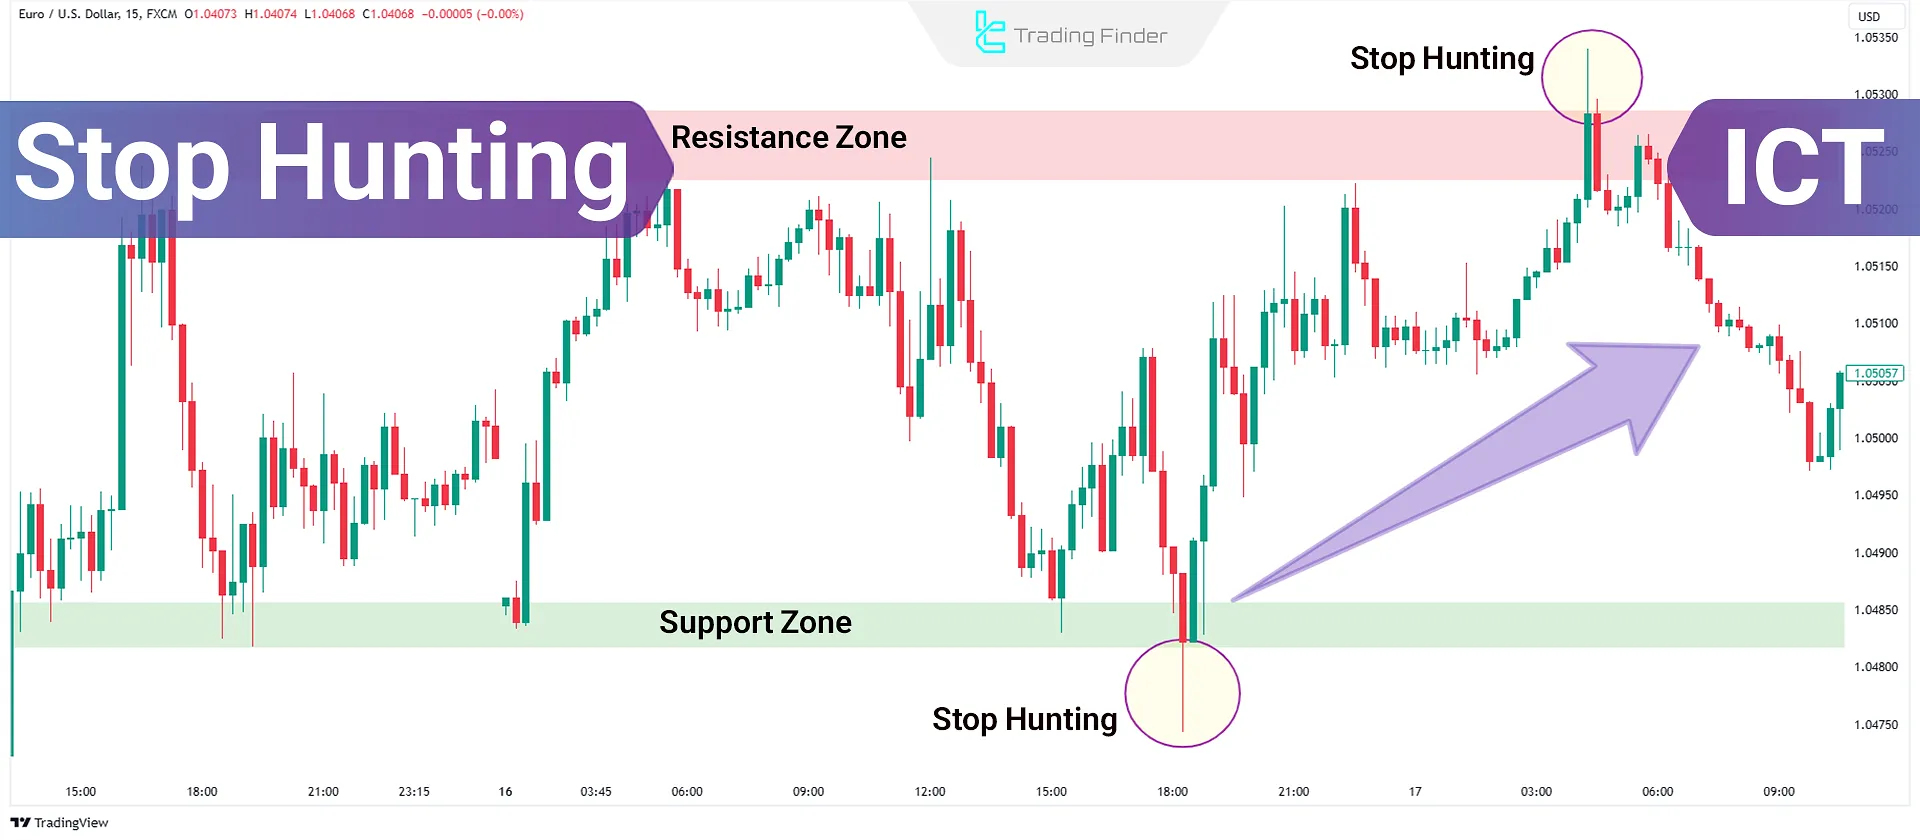
2. Identifying Liquidity Sweeps in Action
The best way to learn to recognize these is to see them happen. The following video provides a comprehensive breakdown of what liquidity sweeps are, why they happen, and how they appear on a chart.
The ONLY Liquidity Sweeps Video You’ll Ever Need
The video 'The ONLY Liquidity Sweeps Video You’ll Ever Need' by TJR is an excellent resource that covers this concept in detail. We'll watch it in segments.
First, watch from the beginning to 06:42. This section reinforces the 'why' behind sweeps, explaining the institutional need to fill orders by targeting areas where retail stops are placed.
Now that you have the foundational "why," let's focus on the practical "what." As the video explains, sweeps happen on all timeframes, but certain types of liquidity are more significant than others.
The ONLY Liquidity Sweeps Video You’ll Ever Need
Continuing with the same video, we will now focus on the different types of high-value liquidity that are often targeted for sweeps.
Watch from 14:44 to 36:59. This is the core of the lesson. Pay close attention to: Live Examples (from 14:44): Observe how sweeps look on a real candlestick chart. High-Confluence Liquidity (from 19:35): The presenter identifies three key types: session highs/lows, relative equal highs/lows, and low-resistance (trendline) liquidity. Understanding these will help you focus on the sweeps that matter most. The Importance of Timing (from 32:25): Notice the emphasis on session opens (Asia, London, New York) as prime time for these manipulations to occur.
3. Sweep or Breakout? The Critical Distinction
This is the most important question you'll face in real-time. When price breaks a high, is it a sweep that will reverse, or is it a genuine Break of Structure (BOS) that will continue?
A simple but powerful rule of thumb is to consider the higher-timeframe market structure:
- In a bullish trend, a run below a swing low (SSL) is more likely to be a liquidity sweep before price continues higher. A run above a swing high (BSL) is more likely to be a Break of Structure (BOS) continuing the trend.
- In a bearish trend, a run above a swing high (BSL) is more likely to be a liquidity sweep before price continues lower. A run below a swing low (SSL) is more likely to be a Break of Structure (BOS).
The next video explains this distinction between a "liquidity run" (BOS) and a "liquidity sweep" (or purge/stop hunt) very clearly.
Liquidity Run Or Liquidity Sweep ( Purge Or Bos )
The video 'Liquidity Run Or Liquidity Sweep' by ETM FX directly addresses how to differentiate between a continuation and a reversal when a swing point is taken.
Watch from the beginning to 08:09. Focus on how the presenter uses the prevailing trend (bullish or bearish) to anticipate whether a run on a high or low will be a sweep or a continuation.
To solidify these concepts, the article below provides a fantastic summary table comparing Stop Hunts and Liquidity Sweeps. While the terms are often used interchangeably, this table highlights the subtle differences in intent and character, which is very useful.
Liquidity Sweeps vs Stop Hunts: Key Differences Explained
The article 'Liquidity Sweeps vs Stop Hunts' from Zeiierman Trading offers precise definitions and a comparative analysis.
Read the sections 'What exactly is a stop hunt?', 'What are liquidity sweeps?', and pay close attention to the table under 'Key Differences Between Stop Hunts and Liquidity Sweeps'. This table is an excellent reference for summarizing the characteristics of each.
From Manual Recognition to Automation
As you train your eye to spot these sweeps, remember your goal of building trading bots. The logic you're learning can be translated directly into code. An algorithm to detect a liquidity sweep would follow these steps:
- Identify a Liquidity Pool: Programmatically find a significant swing high or low (BSL/SSL).
- Detect the Pierce: Check if the price trades through this level.
- Confirm the Reversal: Check if the candle that pierced the level closes back inside the previous price range.
- Signal: If all conditions are met, flag the event as a liquidity sweep, potentially triggering an alert or a trade entry based on further rules.
This structured thinking is the bridge between discretionary chart analysis and systematic, automated strategies.
Test your understanding!
The image below shows a bullish market structure (higher highs and higher lows). Price then makes a move that takes out the previous swing low.

- Based on the higher-timeframe bullish trend, is this move below the previous low more likely to be a liquidity sweep or a Break of Structure (BOS)?
- What is the institutional logic behind this move? What are they trying to achieve?
- After this event (labeled "Liquidity taken out" and "Stop Hunt"), where would you anticipate price might go next?
Show answer
- Given the established bullish trend, this move below a swing low is most likely a liquidity sweep (stop hunt). A true reversal would require a more significant shift in market structure.
- Institutions are driving price down to the Sell-Side Liquidity (SSL) below the swing low. This triggers sell-stops from traders who bought earlier and attracts breakout sellers. The institutions use this flood of sell orders to fill their own large buy orders at favorable prices.
- After accumulating their long positions during the sweep, the logical next target for price would be to the upside, likely targeting the Buy-Side Liquidity (BSL) resting above the most recent swing high to continue the overall bullish trend.
Conclusion
You can now recognize one of the most fundamental patterns of institutional manipulation. Instead of being a victim of stop hunts, you are on your way to seeing them as potential opportunities.
Key Takeaways:
- A liquidity sweep (or stop hunt) is a rapid price move through a key high or low, followed by a sharp reversal.
- It is an intentional move by institutions to trigger orders and build the liquidity needed to fill their large positions.
- The key visual is a sharp wick or candle body that pierces a clear liquidity level and then fails to hold, closing back within the prior range.
- The overall market trend is crucial for distinguishing a sweep (counter-trend probe) from a Break of Structure (pro-trend continuation).
Preview for the Next Lesson:
We have now defined liquidity pools and identified what happens when price reaches them. In our final lesson of this module, we will learn to anticipate price movement towards significant liquidity pools. You will learn how to analyze the chart to determine which pool of liquidity—the one above or the one below—is the market's most likely next destination.