Hello! Welcome to the next lesson in your ICT trading journey.
In our last session, we focused on establishing a directional bias by mapping market structure across multiple timeframes. You learned that the higher timeframe sets the "rules of the game," telling you whether you should be looking for buying or selling opportunities.
Now, we'll answer the next logical question: if we know the general direction, where is the price likely to go? Price movement isn't random; it's a deliberate process of seeking out and absorbing orders. This lesson focuses on the "fuel" that drives these moves. We will learn to identify buy-side (BSL) and sell-side (SSL) liquidity pools. Mastering this will give you logical, objective targets for your trades and a deeper understanding of why price moves the way it does.
1. What is Liquidity and Why Does It Matter?
Before we start marking up charts, we need to understand the concept of liquidity from an institutional perspective. In simple terms, liquidity refers to the ability to buy or sell an asset without causing a significant change in its price.
For large institutions ("smart money") that need to execute multi-million dollar trades, this is a major problem. If they try to buy a huge amount at once, they'll drive the price up against themselves, getting worse and worse fills. To avoid this, they need to find places on the chart where a massive number of sell orders are already waiting. Conversely, to sell a large position, they need to find a pool of waiting buy orders.
These pools of waiting orders are what we call liquidity.
To hear this concept explained by the founder of ICT, watch the first part of the following video. It frames liquidity as the core mechanism that allows smart money to operate efficiently.
ICT Mentorship Core Content - Month 04 - Liquidity Pools
The video 'ICT Mentorship Core Content - Month 04 - Liquidity Pools' by The Inner Circle Trader provides the foundational 'why' behind the concept. It explains the smart money motivation for seeking liquidity.
Watch from 00:38 to 03:14. Focus on these key ideas: The Smart Money Goal: To sell at a premium (high prices) and buy at a discount (low prices). Pending Orders: How stop-loss orders and breakout entry orders from retail traders create pools of liquidity. Pairing Orders: Smart money pairs their large buy orders with the sell-side liquidity below the market and their sell orders with the buy-side liquidity above the market.
This brings us to a fundamental insight: retail traders, often unknowingly, provide the liquidity that institutions need. By understanding where these liquidity pools form, we can begin to anticipate where the market is likely to be "engineered" to go next.
2. Identifying Buy-Side and Sell-Side Liquidity Pools
Now for the practical part: where do these pools of orders accumulate? The answer is at obvious technical levels that most traders learn to use for placing their stop-loss or entry orders. This makes their behavior predictable.
Let's define our two key terms:
-
Buy-Side Liquidity (BSL): This is a concentration of buy orders resting above a key price high. These orders come from two groups:
- Sellers' Stop Losses: Traders who are short have their protective buy-stop orders placed just above a recent high.
- Breakout Buyers: Traders waiting to buy as soon as the price breaks above a resistance level.
-
Sell-Side Liquidity (SSL): This is a concentration of sell orders resting below a key price low. These orders come from:
- Buyers' Stop Losses: Traders who are long have their protective sell-stop orders placed just below a recent low.
- Breakout Sellers: Traders waiting to sell as soon as the price breaks below a support level.
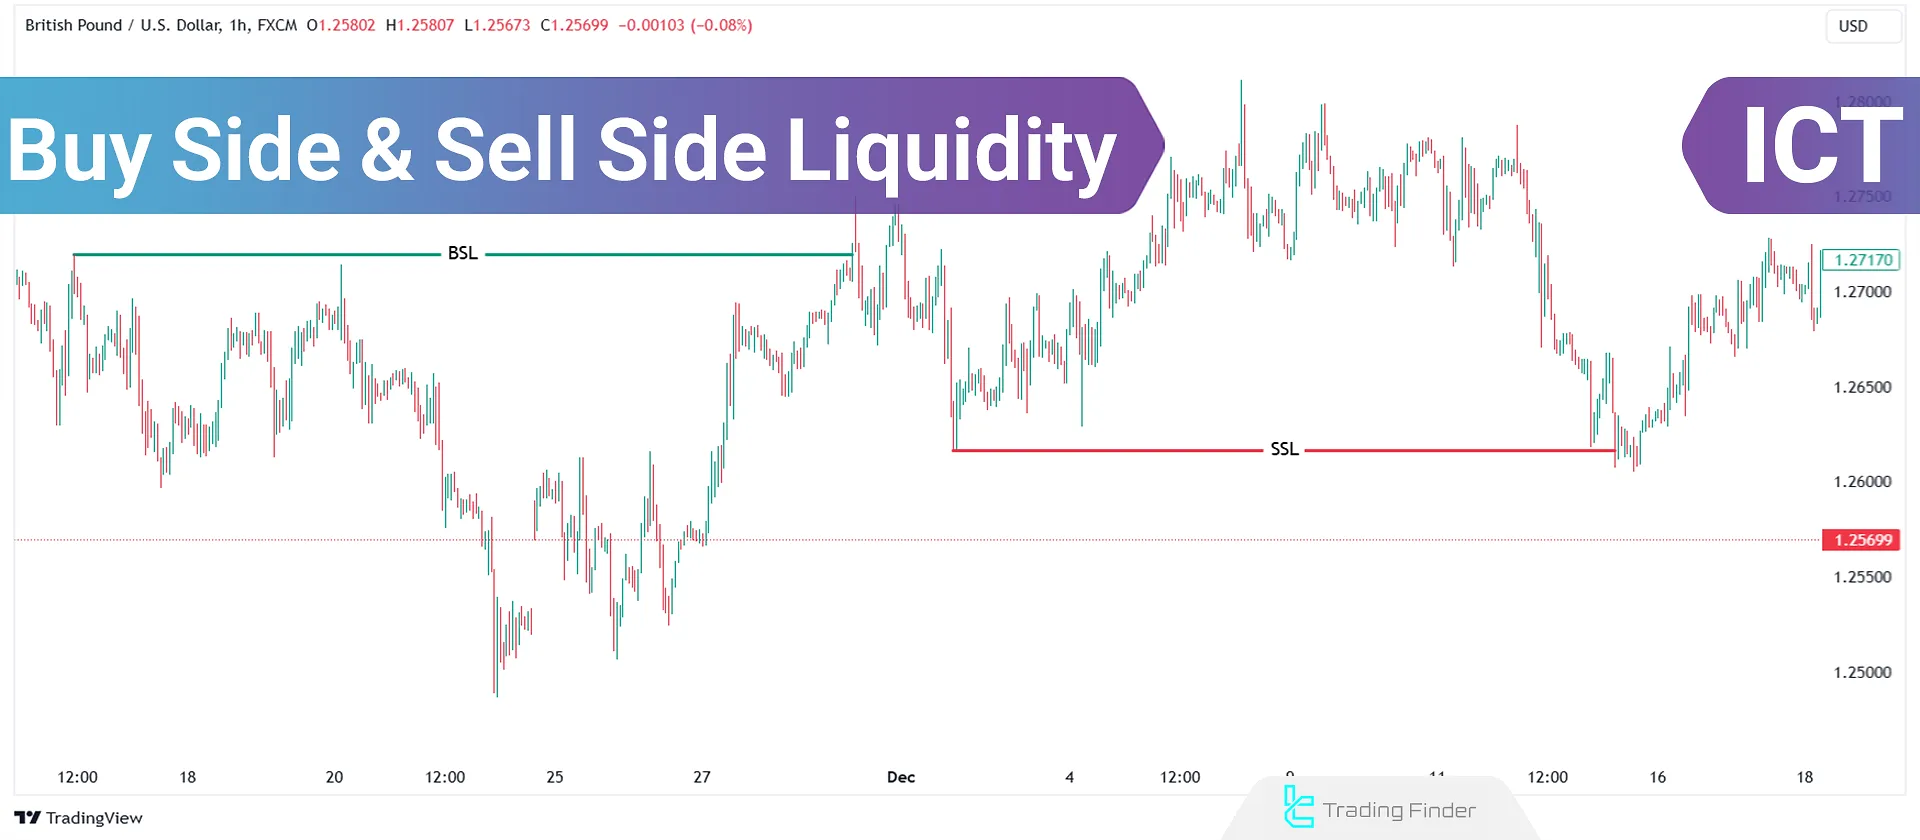
To get a quick and clear overview, the following text provides excellent definitions and characteristics for both BSL and SSL.
Buy Side & Sell Side Liquidity (BSL & SSL) | ICT & SMC ...
The article 'Buy Side & Sell Side Liquidity (BSL & SSL)' from TradingFinder offers a concise summary of these concepts.
Please read the first three sections: 'What are BSL and SSL?', 'Mechanism of Buy-Side Liquidity (BSL) and Sell-Side Liquidity (SSL) Formation in the Market', and 'Difference Between Buy-Side and Sell-Side Liquidity (BSL & SSL)'. Pay special attention to the table comparing the two, as it's a great quick-reference guide.
3. Common Liquidity Hotspots
Liquidity isn't spread evenly. It clusters at very specific, predictable points on the chart. Your job is to train your eye to spot these "hotspots."
The most common places to find significant liquidity are:
- Old Swing Highs and Lows: Any significant past turning point is a magnet.
- Equal Highs (EQH) and Equal Lows (EQL): When price tests a level multiple times but fails to break it, it creates a very clean, obvious level. This is a prime target for a liquidity run because many traders will see it as strong resistance/support and place their stops right above/below it.
- Previous Day's High and Low (PDH/PDL): These are major reference points for many traders.
- Previous Week's High and Low (PWH/PWL): Even more significant reference points, often acting as targets for weekly price moves.
- Session Highs and Lows: The highs and lows of the Asia, London, and New York sessions are key intraday liquidity levels.
The following video provides an excellent visual walkthrough of identifying these various types of liquidity on a real chart.
Liquidity: Buyside & Sellside - ICT Concepts
The video 'Liquidity: Buyside & Sellside - ICT Concepts' from TTrades offers a practical guide to spotting these different types of liquidity levels.
Watch from 01:39 to 09:18. Observe how the presenter marks: Obvious swing highs and lows as BSL and SSL. Distinguishes between single 'old highs/lows' and 'relatively equal highs/lows'. Marks out the previous day's high/low and session highs/lows to frame a narrative for price movement.
Test your understanding!
Look at the chart below. Price first moves down, creating a low, then rallies to create a high, before moving down again to take out the initial low, and finally rallying to take out the high.

- Where is the Sell-Side Liquidity (SSL) located?
- Where is the Buy-Side Liquidity (BSL) located?
- Why do you think price moved down to the SSL before moving up to the BSL?
Show answer
- The Sell-Side Liquidity (SSL) is located below the first significant swing low that was formed.
- The Buy-Side Liquidity (BSL) is located above the swing high that was formed after the first low.
- In this scenario, a common institutional play is to first drive price down to the SSL to trigger all the sell-stop orders from early buyers. Smart money uses this flood of sell orders to accumulate their large long positions at a discount. Once their positions are filled, they have the fuel to aggressively drive the price up to their objective: the Buy-Side Liquidity pool.
Connecting to Your Automation Goal
The ability to identify these liquidity levels is not just for manual trading. It is a fundamental building block for the trading bots you aim to create. In future modules, you will learn to write Python code to:
- Scan price data to programmatically identify swing highs and swing lows.
- Label these levels as potential BSL and SSL.
- Use these levels to define logical take-profit targets for your automated strategies.
The "Buy-Side and Sell-Side Liquidity Indicator" mentioned in one of your readings (LINK) is a perfect example of this. It's a tool that automates the exact visual analysis you are learning to do now. Your goal will be to build your own version of this logic from scratch.
Conclusion
You've now added a crucial layer to your market analysis. By combining the directional bias from the last lesson with the concept of liquidity, you can form a much more complete trade idea: "My higher-timeframe bias is bullish, and I see a major pool of buy-side liquidity 100 pips above the current price. Therefore, I will look for an opportunity to buy, with that liquidity pool as my target."
Key Takeaways:
- Liquidity is the Market's Fuel: Price moves to areas where orders are clustered to facilitate large institutional transactions.
- BSL is Above Highs: Buy-Side Liquidity (buy-stops) accumulates above swing highs, especially equal highs.
- SSL is Below Lows: Sell-Side Liquidity (sell-stops) accumulates below swing lows, especially equal lows.
- Liquidity Provides Targets: Identifying these pools gives you logical and objective areas to target for profit-taking.
Preview for the Next Lesson:
Knowing where the liquidity is located is the first step. The next is recognizing the precise moment price attacks these levels. This event is called a liquidity sweep or a stop hunt. In our next lesson, you will learn to identify these sweeps on a chart, as they often provide powerful, high-probability entry signals for reversals.