Hello! Welcome back.
In our last lessons, you learned to identify the two most critical events in market structure: the Break of Structure (BOS) for trend continuation and the Change of Character (ChoCH) for potential trend reversal. While powerful, these signals can be misleading if viewed in isolation on a single chart. A bearish ChoCH on a 5-minute chart might be insignificant noise within a strong 4-hour uptrend.
This lesson bridges that gap. You will learn to map market structure across multiple timeframes to establish a strong, reliable directional bias. This skill, known as top-down analysis, is the cornerstone of professional trading. It moves you from simply spotting patterns to understanding the market's overarching story. For your goal of building trading bots, mastering this systematic process is non-negotiable, as it provides the core logic for any automated strategy.
1. The Principle of Timeframe Hierarchy
Before we dive into the "how," we need to understand the "why." Different timeframes don't have an equal say in where the price is going. There is a clear hierarchy of command.
To grasp this foundational mindset, watch the first part of this video. It explains the philosophy behind top-down analysis with exceptional clarity.
Master This Principle In Top Down Analysis | The Inner Circle Trader
The video 'Master This Principle In Top Down Analysis' by Trading Dominatus establishes the core philosophy: higher timeframes don't predict, they constrain. This is the bedrock of multi-timeframe analysis.
Watch from the beginning to 02:18. Focus on these key ideas: Hierarchy of Authority: Why the daily chart has more authority than the 5-minute chart. Boundaries, Not Predictions: The higher timeframe's job is to provide boundaries—the 'dealing range'—not to tell you exactly what will happen next. Directional Permission: The goal is to determine where price is allowed to go, which filters out noise and weak setups.
The core takeaway is this: The higher timeframe (HTF) is the general, and the lower timeframe (LTF) is the soldier. The general sets the strategy and defines the battlefield (the directional bias and dealing range). The soldier's job is to execute the mission with precision on the ground (finding an entry). A soldier acting without the general's orders is trading on randomness.
2. The Fractal Nature of Market Structure: A Run Becomes a Trend
Now, let's get into the mechanics. The relationship between timeframes is based on a simple, fractal principle that is the "secret sauce" of market structure analysis.
To understand this, we'll turn to an excellent video by Matt Donlevey that breaks it down perfectly.
How to Understand Multi-Timeframe Market Structure - MUST WATCH | SMC | FOREX [Part 2]
The video 'How to Understand Multi-Timeframe Market Structure' from Photon Trading will walk us through the core mechanical relationship between different timeframes.
First, watch from 05:50 to 06:36 to hear the core principle. Then, watch from 08:14 to 11:48. This is the most important theoretical part of our lesson. Pay close attention to how he explains that a higher timeframe pullback is facilitated by a lower timeframe trend change.
Let's break down what you just saw.
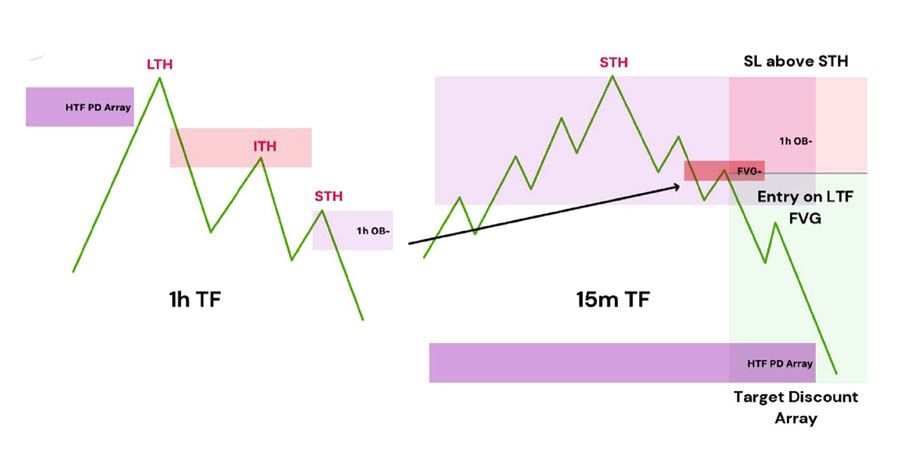
- The Principle: A run on a higher timeframe is a trend on a lower timeframe.
- Bullish Scenario:
- The 4-hour (HTF) chart is in a bullish trend, making a Higher High (BOS).
- After the BOS, we expect a pullback on the 4-hour chart.
- This 4-hour pullback will appear as a full-blown bearish trend on the 15-minute (LTF) chart, with its own lower lows and lower highs.
- When the 4-hour pullback is complete and ready to resume its uptrend, the 15-minute chart will signal this with a bullish Change of Character (ChoCH).
This is the "aha!" moment where your knowledge of BOS and ChoCH becomes truly powerful. A ChoCH on your lower timeframe can be your confirmation that the higher timeframe pullback is over and the dominant trend is about to resume.

3. A Systematic Process for Top-Down Analysis
To avoid confusion and "narrative shopping" (flicking through timeframes to find one that matches what you want to see), you need a fixed, repeatable process. This is how you build a consistent directional bias.
We will use a three-tiered approach. To give these structural points more precise names, we'll borrow the ICT terminology of Long-Term, Intermediate-Term, and Short-Term highs and lows.
A Free Guide to Advanced Market Structure in ICT
The article 'A Free Guide to Advanced Market Structure in ICT' gives us a formal language for labeling the importance of different swing points. This will add clarity to our analysis.
Please read the sections defining 'Highs' (STH, ITH, LTH) and 'Lows' (STL, ITL, LTL). Don't worry about memorizing them instantly. Just understand the concept: a Long-Term High (LTH) is a major swing high, while a Short-Term High (STH) is a minor one. This hierarchy is key.
Here is our systematic process:
-
The HTF Narrative (e.g., Daily/Weekly):
- Goal: Establish the overall market direction.
- Action: Identify the major swing highs and lows that define the current trend. These are your Long-Term Highs (LTH) and Long-Term Lows (LTL). Is the market making higher LTLs and breaking LTHs (bullish), or vice versa (bearish)?
- Question to Answer: Am I fundamentally looking for buying or selling opportunities in the grand scheme of things?
-
The MTF Context (e.g., 4-Hour):
- Goal: Understand where price is within the HTF narrative.
- Action: Map the current trend on the 4-hour chart. These are your Intermediate-Term Highs (ITH) and Intermediate-Term Lows (ITL). Is this 4H trend aligned with the Daily trend (a pro-trend move) or moving against it (a pullback)?
- Question to Answer: Is the market currently continuing the main trend or is it taking a breather (pulling back)?
-
The LTF Signal (e.g., 15-Minute):
- Goal: Time your entry and find confirmation.
- Action: Drill down to the 15-minute chart. If the 4H is pulling back against a bullish Daily trend, you are waiting for the 15M bearish trend to fail. The signal is a bullish ChoCH on the 15M chart (breaking a Short-Term High/Low).
- Question to Answer: Has the HTF pullback shown signs of ending, giving me the green light to enter in the direction of the main trend?
The following guide provides a concise summary of this top-down workflow.
Guide to Top-Down Analysis in ICT
The 'Guide to Top-Down Analysis in ICT' from CryptoCraft offers a great, quick reference for the step-by-step process we are learning.
Read the section 'Step-by-Step Top-Down Analysis Framework'. Notice how it moves from Daily for bias, to 4-Hour for confirmation, down to 15-Minute and lower for entry signals. This reinforces our systematic approach.
Test your understanding!
Imagine the EUR/USD Daily chart is strongly bullish, having just broken a major Long-Term High (LTH). The 4-hour chart has been trending down for the last day, creating a series of Intermediate-Term Lows (ITL). Suddenly, on the 15-minute chart, price rallies aggressively and breaks above the most recent 15-minute lower high.
Based on our top-down analysis, what is the most likely scenario, and what should you be looking for next?
Show answer
The most likely scenario is that the 4-hour pullback is ending, and the dominant Daily bullish trend is about to resume.
The 15-minute bullish Change of Character is the first signal that confirms this. The next step would be to wait for a small pullback on the 15-minute chart into a "discount" area, providing a high-probability entry to get long and target a new 4-hour/Daily high.
4. Practical Application: A Chart Walkthrough
Theory is great, but seeing this applied to a real chart is where it all clicks. We will return to the Photon Trading video, which contains an in-depth walkthrough applying these exact principles.
Now, let's see it in motion.
How to Understand Multi-Timeframe Market Structure - MUST WATCH | SMC | FOREX [Part 2]
We will now watch the extended practical application from the Photon Trading video. The presenter will walk through a chart, applying the top-down analysis method we've just discussed.
This section is long, so we'll focus on the key moments. Please watch from 33:55 to 44:40. Follow along as he: Starts on the Weekly chart to establish the LTH and LTL, defining the macro range. Drops to the Daily chart to show how a Daily trend change confirms the start of the Weekly pullback. Shows how a 4-hour trend change can be anticipated by a Daily change of character. Explains why a bearish 4-hour trend might fail if it's just a Daily pullback (41:50 is a crucial part). This walkthrough connects all the dots from our lesson.
Conclusion
Congratulations! You have just learned what is arguably the most important skill in discretionary trading and the foundational logic for algorithmic trading: establishing a directional bias through multi-timeframe analysis. You are no longer just looking at one-dimensional patterns; you are reading the market's three-dimensional story.
Key Takeaways:
- Hierarchy is everything: Higher timeframes constrain lower timeframes. The HTF sets the rules.
- A run is a trend: A price leg (run) on your HTF is a complete trend on your LTF.
- The system is key: Always work from the top down (e.g., Daily → 4H → 15M). Start with the narrative, find the context, and then look for the signal.
- LTF ChoCH confirms HTF continuation: A ChoCH on your lower timeframe is often the best signal that a higher timeframe pullback has ended and the dominant trend is resuming.
Preview for the Next Lesson:
Now that you know how to determine the market's most likely direction, the next logical question is: where is it going? Price doesn't move randomly; it moves from areas of liquidity to other areas of liquidity. In our next lesson, we will identify buy-side and sell-side liquidity pools (BSL/SSL). These will become your logical take-profit targets.