Hello! In our last lesson, we explored how to methodically diagnose a common but tricky performance signal: a rising median latency while the tail latency remains stable. You learned that the cause is often a shift in the traffic mix, and that segmentation is the key to proving it. This kind of disciplined, evidence-based reasoning is a cornerstone of senior-level performance engineering.
Today, we move from interpreting latency distributions to understanding a fundamental law that governs the behavior of almost any system under load. We will introduce Little's Law, a simple yet profound formula that connects throughput, latency, and concurrency. For a performance engineer, this law is as fundamental as Ohm's law is for an electrical engineer. It provides a powerful mental model for reasoning about system capacity, validating test results, and making quick, back-of-the-envelope calculations that can guide your entire diagnostic process.
The Foundation: Little's Law
At its heart, Little's Law describes the relationship between the number of items in a system, how long they stay, and the rate at which they move through. Its elegance lies in its simplicity and universality.
The following resource provides a crisp introduction to the formula and its variables, translating them from their academic origins in queuing theory into terms you use every day in the context of distributed systems.
Little's Law Applied to Distributed Systems | Octocore Performance
This article from Octocore Performance clearly defines Little's Law and maps its variables to the metrics you see in your monitoring tools.
Focus on the sections "The Formula" and "Translating to Distributed Systems". Pay close attention to the table that maps queuing theory concepts to concrete system metrics.
As you've just read, the law is stated as:
Where, for our purposes as performance engineers:
- L is Concurrency: The average number of requests being processed simultaneously in the system (sometimes called "in-flight" or "active" requests).
- λ (lambda) is Throughput: The average rate at which requests arrive (and, in a stable system, depart), measured in requests per second.
- W is Latency: The average time a request spends in the system, from start to finish, measured in seconds.
So, for us, the formula becomes:
Concurrency = Throughput × Latency
If you know any two of these values, you can calculate the third. For example, if a service is handling 200 requests per second (throughput) and each request takes an average of 0.5 seconds (latency), the average number of concurrent requests is:
This means that, on average, there are 100 requests active in the system at any given moment.
Why This Matters: From Formula to Insight
Knowing the formula is one thing; applying it to gain insight is what separates a junior from a senior engineer. Little's Law is a powerful tool for resource planning, result validation, and bottleneck diagnosis.
The Latency Effect: Quantifying the Cost of Slowness
Little's Law makes it startlingly clear how latency impacts resource requirements. A slower system needs more concurrent capacity to sustain the same throughput, consuming more memory, threads, and connections.
The chart below provides a stark visualization. To achieve the same throughput of 200 req/sec, a system with 2-second latency requires four times the concurrency (and thus, resources) as a system with 0.5-second latency.

This chart illustrates Little's Law by comparing a "Fast System" (0.5s latency) and a "Slow System" (2s latency). To maintain an identical throughput of 200 req/sec, the slow system must handle 400 concurrent requests, four times the 100 requests handled by the fast system.
This isn't just about user experience; it's about cost and efficiency. A 10% latency improvement can translate directly into a 10% reduction in the concurrent resources needed, which can be a significant saving in a large-scale cloud environment.
The following reading expands on this and other practical applications, such as capacity planning and identifying bottlenecks.
Little's Law Applied to Distributed Systems | Octocore Performance
This part of the article demonstrates how to use the law for practical engineering decisions.
Read the sections "Why This Matters". Note how the law is used for resource sizing, identifying bottlenecks, and capacity planning.
Application in Your World: Workload Modeling
Your experience with JMeter involves setting a number of "concurrent users" (threads) and having them execute a script. Little's Law is the theoretical basis for calculating how many users you need to generate a specific target throughput. However, in this context, we must use a variation of the law that accounts for user "think time" and script pacing.
The formula for this closed-loop model is:
Number of Users = Throughput × (Response Time + Think Time + Pacing)
Let's watch a short video that explains this application in the context of performance testing.
What is Little's Law in Performance Testing? | Test Planning | Workload Modelling by Perfology 2020
This video by Perfology directly addresses how Little's Law is used in performance test planning, which should be very familiar from your work with JMeter.
Watch from the explanation. The key part is how they break down "total execution time" into response time, think time, and pacing, and then use it to calculate the required number of users for a target throughput.
This is an incredibly practical application. For example, if an architect provides a non-functional requirement of "3600 transactions per hour," you can use Little's Law to translate that into a concrete test configuration.
The following resource gives a great example of using this formula not just for planning, but for validating test results.
This article from the SPE BoK demonstrates how to use Little's Law as a sanity check on your performance test results.
Read the section "Applying Littles Law". Focus on the second example, "Validate System Performance Testing Results." This is a critical skill for identifying when your test harness or the system is behaving unexpectedly.
Knowing the Limits: When the Law "Breaks"
Little's Law is powerful, but it has one major prerequisite: it applies to stable systems in a steady state. A steady state is a condition where, on average, the rate of arrivals equals the rate of departures. The number of requests in the system might fluctuate, but it revolves around a stable average.
What happens when the arrival rate exceeds the system's capacity to process requests? The system is no longer stable. The queue of waiting requests grows, and latency increases without bound. This is often called thrashing.
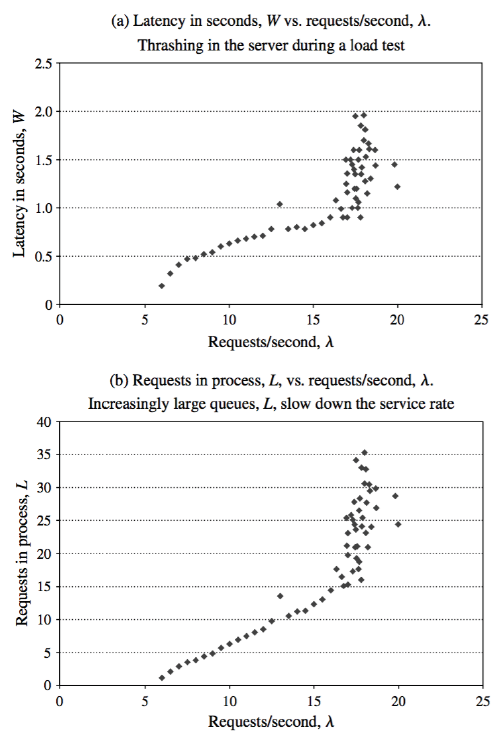
These plots show data from a real server load test. As requests per second (λ) increase, latency (W) and requests in process (L) remain stable at first. However, beyond a certain point (~15 req/s), the system saturates, and both latency and the number of queued requests increase dramatically. This is the point where the "steady state" assumption of Little's Law breaks down.
This transition from a stable state to a saturated one is a key behavior you look for in load tests. We will explore this "saturation knee" in detail in a future module on scalability analysis.
Finally, a crucial caveat: Little's Law operates on averages. Your last lesson was all about why averages can be deceiving and why percentiles (p95, p99) are so important. The concurrency calculated by Little's Law is an average concurrency. Due to natural variation, the peak concurrency will be higher. Always keep this in mind.
Little's Law Applied to Distributed Systems | Octocore Performance
This final section of the Octocore article covers the critical limitations and caveats you must be aware of when applying the law.
Read the section "Limitations and Caveats", paying special attention to the points on "System Must Be Stable" and "Averages Hide Variation".
Conclusion
You have now added one of the most fundamental principles of performance engineering to your toolkit. Little's Law provides an essential framework for reasoning about system behavior under load.
Key Takeaways:
- Little's Law provides a simple formula connecting three key metrics: Concurrency = Throughput × Latency.
- It is not just a formula; it's a tool for resource sizing, capacity planning, and validating test results.
- Higher latency directly increases the concurrency required to sustain a given throughput, impacting resource consumption and cost.
- For closed-loop load testing (like with JMeter), you must use the variant that includes think time and pacing.
- The law's primary limitation is that it applies only to stable systems in a steady state and operates on averages, which can hide important tail-latency behavior.
In our next lesson, we will build directly on this foundation by learning how to formally identify the steady-state period in a load test, distinguishing it from warm-up and cool-down phases. This is the exact period where Little's Law holds true and where your most important measurements are taken.