Welcome to the next lesson in our journey through the Indian equity market ecosystem. In our last session, we detailed the operational backbone of trading: the T+1 settlement cycle and the function of demat and trading accounts. You now have a clear picture of how a transaction, from order placement to final ownership transfer, is processed.
Today, we shift our focus from the process to the product of that process: market data. For your goal of building quantitative trading strategies, data is the fundamental raw material. Understanding its different forms, granularities, and uses is a prerequisite for any analysis or model building. Our objective is to differentiate between the three primary types of market data: end-of-day (EOD) data, tick data, and Level 2 order book data.
The Spectrum of Market Data
Think of market data as existing on a spectrum of detail, from a high-level daily summary to a granular, millisecond-by-millisecond stream of every single market event. The type of data you use depends entirely on the questions you want to answer and the time horizon of your strategy.
We will explore this spectrum starting from the least granular (EOD) and moving to the most detailed (tick and order book data).
1. End-of-Day (EOD) Data: The Daily Summary
The simplest form of market data is End-of-Day, or EOD, data. As the name implies, this is a summary of all trading activity for a particular stock over an entire trading day, delivered after the market closes.
EOD data consists of five key data points for each day:
- Open (O): The price of the first trade of the day.
- High (H): The highest price at which the stock traded during the day.
- Low (L): The lowest price at which the stock traded during the day.
- Close (C): The price of the final trade of the day.
- Volume (V): The total number of shares traded during the day.
From a data engineering perspective, this is the most compact representation of market activity. It's relatively small in size and is the standard for long-term analysis, such as backtesting swing trading or positional investment strategies. Because it smooths out all the intraday "noise," it's useful for identifying multi-day or multi-week trends.
2. Real-Time Data: The Intraday Firehose
While EOD data provides a useful summary, it completely hides what happened during the trading day. To capture this, we need real-time data feeds. However, "real-time data" is not a single concept; it comes in different "levels" of depth and detail.
To begin, let's understand why this distinction is important. Please read the introduction from the following article by TrueData, a provider of financial data in India.
The 4 Levels of Real Time Data from NSE, BSE & MCX
This article introduces the concept of different "levels" of real-time data from Indian exchanges, which is crucial for understanding the data available for quantitative strategies.
Please read the introduction and the section titled What is Market Depth? This will frame our discussion on the different types of real-time feeds.
As the article explains, the key differentiator is market depth, which refers to the visibility into the exchange's order book. We can broadly categorize real-time data into two main types: data on executed trades (tick data) and data on pending orders (order book data).
A. Tick-by-Tick (TBT) Data: The Record of Executed Trades
The most granular log of what has already happened is tick-by-tick data. A "tick" represents a single event in the market. In its simplest form, this can mean a single executed trade. A stream of trade data would consist of a series of records, each containing at a minimum:
- A precise timestamp
- The trade price
- The quantity (volume) of shares traded
However, the most comprehensive data feeds, often called Tick-by-Tick (TBT) by the exchanges, contain much more than just trades. They include every single message sent to the exchange's matching engine: new orders, modifications to existing orders, and cancellations.
The image below breaks down the components you might find in a full TBT feed from an exchange like the NSE.
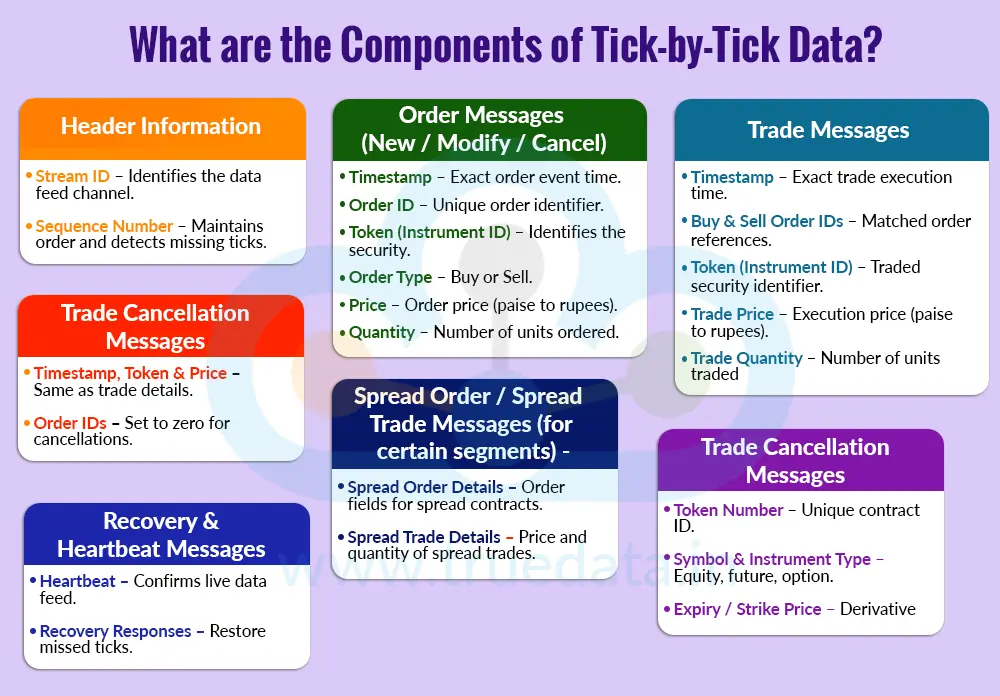
Handling this level of data presents a significant engineering challenge due to its immense volume, often requiring specialized hardware and software. Let's see what the TrueData article says about the NSE's specific feed.
The 4 Levels of Real Time Data from NSE, BSE & MCX
Now, let's look at the most granular data feed available from the NSE and its intended use case.
Read the section on Tick By Tick data. As a software engineer, pay close attention to the comments on data volume, infrastructure requirements (leased lines, co-located servers), and the primary users (HFT firms).
This TBT data is the "ground truth" of the market and is essential for market microstructure research and developing high-frequency trading algorithms. However, for many strategies, it's more important to know what is about to happen, which is where order book data comes in.
B. Order Book Data: The Record of Trading Intent
The order book contains all the outstanding limit orders—the "bids" (buy orders) and "asks" (sell orders) waiting to be filled. This data shows the current supply and demand at various price levels, giving you insight into market intent. This is often referred to as Level 1, Level 2, or Level 3 data.
The following video provides a clear, general explanation of the two most common types: Level 1 and Level 2.
Level 1 and Level 2 Market Data
This video offers a foundational look at the difference between seeing just the best price versus seeing the depth of the market.
Please watch the segment explaining Level 1 data, which is also known as the "top of the book." Then, continue with the segment on Level 2 data, often called "depth of market."
To summarize and apply this to our context:
-
Level 1 Data: This is the most basic view of the order book. It shows only the single best bid price and best ask price available at any given moment, along with the quantity of shares available at those prices (the "bid size" and "ask size"). Most standard stock tickers show Level 1 data.
-
Level 2 Data: This provides a deeper view. Instead of just the best bid and ask, it shows a list of bids and asks at multiple price levels, revealing the "depth" of the market. For example, a 5-level deep feed would show you the 5 best bid prices and the 5 best ask prices, along with the total order quantity at each of those levels.
Now, let's return to the TrueData article for a description specific to the Indian market context.
The 4 Levels of Real Time Data from NSE, BSE & MCX
The video provided a general overview. This text will ground those concepts in the context of the NSE and BSE.
Read the section on Level 1 data, followed by the sections on Level 2 and Level 3 data. Note the discussion of who finds this data useful and why—this is key for strategy development.
As the article notes, Level 2 data is crucial for short-term traders and institutional players who need to understand liquidity and order flow to execute large trades with minimal price impact. Level 3 simply provides more depth (e.g., 20 levels vs. 5).
3. Going Deeper: Market by Price (MBP) vs. Market by Order (MBO)
For your goal as an aspiring quant, there is a further, critical distinction within order book data. The Level 2 data we've discussed is typically Market by Price (MBP). This means it aggregates all the orders at a single price level and shows you a total quantity. For example, it might tell you there are 5,000 shares bid at ₹100, but it won't tell you if that's one order for 5,000 shares or 50 orders for 100 shares each.
The most granular form of order book data is Market by Order (MBO). This feed does not aggregate orders. It shows you every individual order in the book and its position in the queue. This is essentially what the "Order Messages" component of the full TBT feed contains.
The following short video provides an excellent visual comparison.
Market Data Feeds (everything you need to know)
Understanding the difference between an aggregated price view and an individual order view is a key concept in quantitative finance. This video illustrates it perfectly.
Watch the section from the explanation of Market by Price (MBP) versus Market by Order (MBO). Then, observe the visual comparison using a Depth of Market (DOM) display to see the practical difference.
MBO data allows for extremely sophisticated analysis, such as modeling queue position or detecting large "iceberg" orders. It is the gold standard for high-frequency market making and microstructure research.
Synthesis and Use Cases
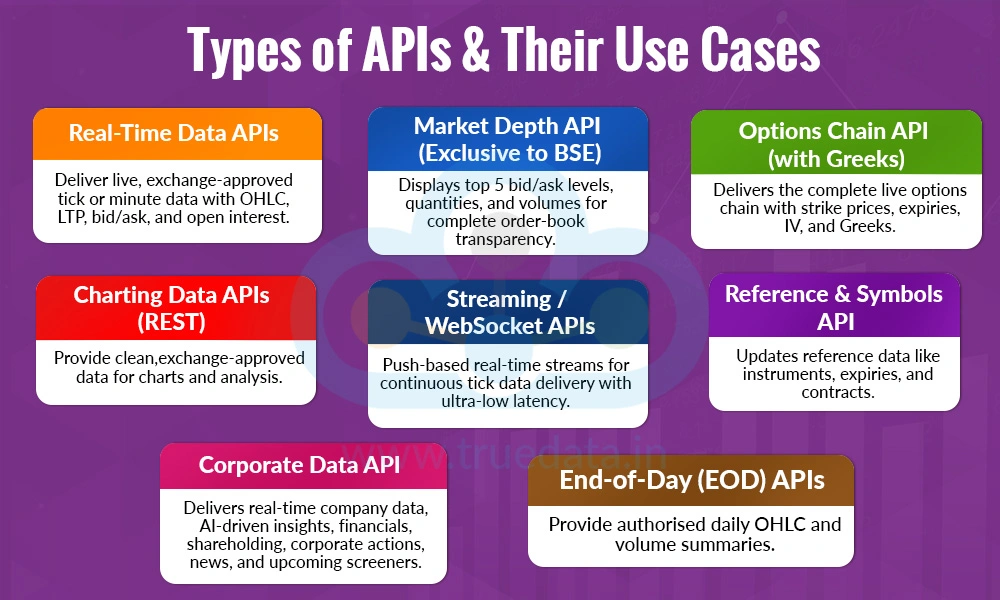
We have now covered the full spectrum of market data. The infographic below ties these data types to their common delivery methods—APIs—which is how you would programmatically access them.
To conclude, let's use a concise table from another resource that summarizes the different granularities of real-time data and their primary applications.
Tick and Level-2 Order Book Data Sources | AI Quantitative Trading: From Zero to One
This table provides a final, structured summary to consolidate your understanding of the different levels of real-time data.
Focus on the table under the heading "2.3 International Tick / Level-2 Sources." The columns for Granularity, Meaning, and Best For offer a perfect summary of the distinctions between L1, L2, and L3 (MBO) data feeds.
Conclusion
In this lesson, we have dissected the different types of data generated by the stock market. Understanding this is fundamental to your journey in quantitative finance, as your choice of data will define the types of strategies you can build.
Here are the key takeaways:
- EOD Data (OHLCV): A daily summary used for long-term analysis and backtesting swing/positional strategies. It has low granularity and data volume.
- Tick Data (Trades): A log of every executed trade. It is highly granular and essential for analyzing trade execution and building very short-term models.
- Level 1 Data: The best bid and ask prices. It provides a basic, real-time view of the market.
- Level 2 Data (Market by Price): Shows the depth of the order book by aggregating orders at multiple price levels. It's used to analyze liquidity and order flow for intraday strategies.
- Level 3 Data (Market by Order): The most granular view, showing every individual order in the queue. It's used for advanced HFT and microstructure research.
The data flow we've discussed is continuous during market hours. However, exchanges have rules that can interrupt this flow to maintain order and prevent excessive volatility. In our next lesson, we will explore one such mechanism: circuit limits and trading halts on Indian exchanges.