In our previous lesson, we explored the various forms of market data, from high-level daily summaries to the granular, real-time flow of every trade and order. This continuous stream of information is the lifeblood of the market. Today, we examine the mechanisms designed to intentionally interrupt this flow: circuit limits and trading halts. These are crucial regulatory tools used by exchanges like the NSE and BSE to manage extreme price volatility and maintain market stability.
Your objective for this lesson is to explain the concept of circuit limits and trading halts on Indian exchanges. We will dissect the two primary types of circuits, understand their triggers, and analyze why they are an integral part of the market's architecture. This knowledge is essential, as these rules define the absolute boundaries of price movement within a single trading session, a hard constraint that must be factored into any quantitative trading model.
The Rationale for Hitting the Brakes
Before diving into the mechanics, it's important to understand why exchanges implement circuit limits. They are not arbitrary rules but rather safety measures designed to protect the market ecosystem. In moments of extreme panic or euphoria, these mechanisms provide a forced "cooling-off" period, allowing market participants to digest news and make more rational decisions.
The following video from the channel VRDNation provides a concise overview of the primary reasons for implementing circuit limits. As you watch, focus on the three main arguments presented.
What are Upper & Lower Circuit Limits?
This video discusses the purpose of circuit limits in the stock market.
Please watch the section from the rationale behind circuits. Note the points made about protecting investors, curbing speculation, and preventing manipulation.
As the video explains, circuit limits serve to:
- Protect Retail Investors: By halting trading during extreme, news-driven moves, they prevent less-informed investors from buying into a speculative bubble or panic-selling at irrational lows.
- Curb Excessive Speculation: They act as a speed bump against momentum-fueled frenzies that can detach a stock's price from its fundamental value.
- Prevent Market Manipulation: They make it harder for operators to artificially "pump and dump" a stock, as the maximum potential gain or loss in a single day is capped.
Two Tiers of Control: Individual Stocks and the Entire Market
In India, circuit limits operate on two distinct levels. Confusing these two is a common error. One system applies to individual stocks, while the other applies to the market as a whole. The financial intelligence platform Oquilia provides a clear article that makes this crucial distinction.
NSE individual stock circuit filters: 2/5/10/20% bands and revision triggers | Oquilia
This article explains the two different circuit mechanisms used in the Indian markets.
Start by reading the introduction to understand the core concept. Pay close attention to the section that explicitly outlines the two mechanisms. Then, continue reading the detailed explanations of both the individual stock price band and the market-wide circuit breaker that follow.
Now that you have a high-level overview, let's break down each mechanism in detail.
Mechanism 1: Individual Stock Price Bands
This is the most common type of circuit limit you will encounter. The NSE and BSE apply a price band to most individual stocks traded in the cash segment. This band defines a range within which the stock is allowed to trade on a given day, calculated based on its previous day's closing price.
The primary price bands are 2%, 5%, 10%, and 20%.
- If a stock's price rises to its upper band limit, it hits the "upper circuit." At this point, there are only buyers and no sellers. Trading is effectively frozen for the rest of the day at that price.
- Conversely, if it falls to its lower band limit, it hits the "lower circuit." Here, there are only sellers and no buyers, and trading is again frozen.
The image below provides a simple visual representation of these common bands.
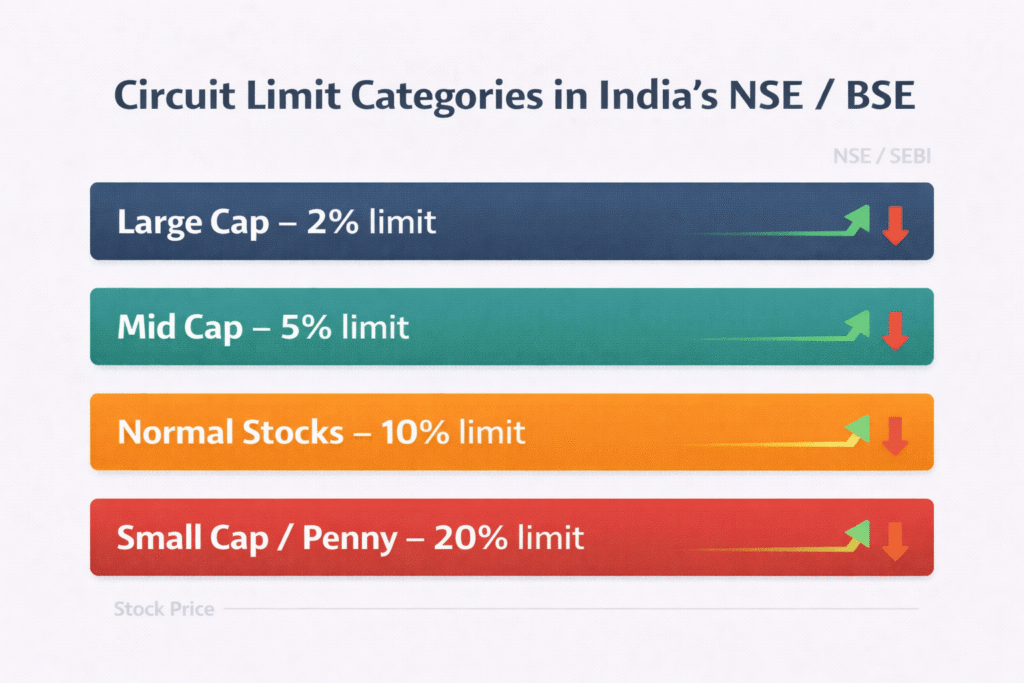
This image illustrates the common circuit limit percentages. The band assigned to a specific stock (e.g., Large Cap, Mid Cap) depends on factors like its volatility and whether it's in the derivatives segment, not just its market capitalization.
The specific band applied to a stock is not arbitrary. Exchanges assign and periodically revise these bands based on the stock's volatility and other risk characteristics. A highly volatile or speculative small-cap stock might be placed in a 2% or 5% band to curb excessive price swings, while a more stable, liquid stock might have a 20% band.
A Critical Exception: F&O Stocks
A crucial point for your future work in quantitative finance is that stocks included in the Futures and Options (F&O) segment do not have these fixed price bands. This category includes most of the large, liquid stocks like those in the Nifty 50.
Instead, they operate under a dynamic price band. The exchange sets an initial 10% band, but if the stock moves sharply, the exchange can relax this limit intra-day after a brief cooling-off period. This allows for greater price discovery while still preventing runaway moves. This is why you can see an F&O stock move more than 20% in a single day, while a non-F&O stock cannot.
The VRDNation video explains this distinction clearly.
What are Upper & Lower Circuit Limits?
This clip differentiates the circuit rules for cash-only stocks versus those in the F&O segment.
Watch the segment discussing the three categories of stocks, paying particular attention to the explanation for F&O stocks and their dynamic limits.
Mechanism 2: Market-Wide Index Circuit Breakers
The second type of circuit is a much more drastic measure that halts trading across the entire market. These are triggered by major movements in the benchmark indices, either the Nifty 50 or the BSE Sensex, whichever is breached first.
These circuit breakers are applied at three thresholds: 10%, 15%, and 20%.
When a market-wide circuit is triggered, trading is halted nationwide in all equity and equity derivatives markets. The purpose is to give the entire market a time-out during events of extreme panic or euphoria.
The duration of the halt depends on the trigger level and the time of day it occurs. The official rules are set by SEBI and published by the exchanges.
This is the official page from the National Stock Exchange detailing the rules for market-wide circuit breakers.
First, read the introduction that explains the system. Then, carefully study the table that specifies the halt durations for each trigger level (10%, 15%, 20%) based on the time of day.
As the table shows, a 10% drop before 1:00 PM triggers a 45-minute halt, while the same drop after 2:30 PM results in no halt. A 20% move at any time halts trading for the remainder of the day.
These events are rare but significant. The chart below shows some historical events that have triggered market-wide circuit breakers in India. Notice the most recent one in March 2020 during the global sell-off triggered by the COVID-19 pandemic.

A chart of the NIFTY 50 index from 2004-2020, highlighting dates where market-wide upper or lower circuit breakers were triggered due to major economic or political events.
Practical Considerations
Trading During a Circuit Lock
When an individual stock is locked in a circuit, you can still place orders, but they will join a queue and are unlikely to be executed.
- Upper Circuit: A long queue of buy orders will form, with no sellers available at or below the circuit price.
- Lower Circuit: A long queue of sell orders will form, with no buyers available at or above the circuit price.
Special Case: IPO Listing Day
To allow for true price discovery when a company first lists on the stock exchange, there are no circuit limits on its listing day. The stock is free to find its market-driven price. The applicable price band is then implemented from the next trading day. The VRDNation video mentions this.
What are Upper & Lower Circuit Limits?
This final clip explains the exception for IPOs.
Watch this short segment on the rules for an IPO listing day.
Conclusion
In this lesson, we have established the rules that govern extreme market movements. You now understand the dual system of circuit limits in India and can differentiate between single-stock price bands and market-wide trading halts.
Key takeaways from our session:
- Purpose: Circuit limits are regulatory tools to control volatility, provide cooling-off periods, and protect investors from panic-driven decisions.
- Two Tiers: The system operates at both the individual stock level (2%, 5%, 10%, 20% static price bands for non-F&O stocks) and the market-wide level (10%, 15%, 20% index movement triggering coordinated halts).
- F&O Exception: Stocks in the derivatives segment have dynamic price bands, allowing for more flexibility than cash-only stocks.
- Trading Halts: Market-wide halts have specific durations depending on the severity of the index move and the time of day, while a stock hitting its circuit is typically frozen for the rest of the session.
Having covered the data that flows through the market and the rules that can stop that flow, we are now ready to examine the costs associated with acting on that data. In our next lesson, we will focus on calculating the various transaction costs involved in an equity trade, including brokerage, STT, and GST.