Hello! In our last lesson, we learned how to assess the statistical significance of a predictor by constructing a confidence interval for its odds ratio and checking if the interval contained the value 1. This is an excellent, intuitive method for understanding the precision and significance of an effect.
Today, we'll build on that by learning how to use formal hypothesis tests to achieve the same goal. This lesson covers how to use Wald or Likelihood Ratio tests to assess the significance of predictors in a logistic regression model. These tests provide a p-value, which is the standard way to formally report the significance of a predictor. Mastering these tests is crucial for your exam, as questions will often provide statistical output and ask you to draw conclusions about a model's predictors.
1. A Quick Refresher: The Three Big Tests
In GLMs, there are three main tests for assessing model parameters: the Wald test, the Likelihood Ratio Test (LRT), and the Score test. All three are based on the log-likelihood function, but they measure "extremeness" in different ways. For your exam, the Wald and Likelihood Ratio tests are the most important.
To get a quick, high-level intuition for how these tests relate to each other, please watch this short introductory video.
Wald test | Likelihood ratio test | Score test
This video from zedstatistics provides a fantastic visual overview of the Wald, Likelihood Ratio, and Score tests. Focus on understanding how each one measures the 'distance' from the null hypothesis on the log-likelihood curve.
Watch the following segments: Introduction (00:23 - 02:53): Understand the basic setup and the log-likelihood function. Wald Test (03:57 - 04:38): Notice that this measures the horizontal distance between the estimate and the null value. Likelihood Ratio Test (07:51 - 08:49): Notice that this measures the vertical distance (difference in log-likelihood). Score Test (10:31 - 11:10): See how this measures the slope at the null value.
Now, let's dive into the practical application of the two most common tests: the Wald and the Likelihood Ratio Test.
2. The Wald Test: Significance of a Single Predictor
The Wald test is the most direct way to test the significance of a single predictor. It answers the question: Is the coefficient for this predictor significantly different from zero?
- Null Hypothesis (): (The predictor has no effect on the log-odds of the outcome).
- Alternative Hypothesis (): (The predictor has an effect).
The test statistic is very simple and should feel familiar. It is the estimated coefficient divided by its standard error.
This -statistic is then compared to a standard normal distribution to get a p-value. In most software output, this is done for you automatically.

How to Use the Wald Test in Practice
For your exam, you simply need to locate the correct line in the regression output table and read the p-value.
12.1 - Logistic Regression | STAT 462
This resource from Penn State's STAT 462 course shows a typical logistic regression output and explains how to interpret the Wald test results.
Please read the section titled 'Wald Test'. Look at the first coefficients table. The 'Z-Value' column shows the calculated Wald statistic for each predictor, and the 'P-Value' column shows its significance. Notice how you can quickly scan this column to identify significant predictors.
As you can see from that reading, you look for the P-Value (sometimes labeled P>|z| or Sig.). If this value is less than your chosen significance level (e.g., ), you reject the null hypothesis and conclude the predictor is statistically significant.
This video from StatQuest provides an excellent walkthrough of interpreting this exact part of the output for both continuous and categorical predictors.
Logistic Regression Details Pt1: Coefficients
Let's watch Josh Starmer from StatQuest apply the Wald test to a practical example. He refers to it as the 'Z-value', which is the Wald statistic.
Please watch these two clips: Continuous Predictor (08:37 - 10:36): See how the Z-value and p-value are used to test the significance of the 'weight' coefficient. Discrete Predictor (16:56 - 17:53): See the same test applied to the 'gene mutant' coefficient, which represents a log-odds ratio.
Key Takeaway for the Wald Test: It's your go-to method for quickly assessing the significance of a single predictor directly from the main coefficient table in your regression output.
3. The Likelihood Ratio Test (LRT): Comparing Nested Models
The Likelihood Ratio Test (LRT) is a more general and often more reliable method. Instead of testing a single coefficient, it compares the fit of two nested models.
- Full Model: The more complex model, which includes the predictor(s) you want to test.
- Reduced Model: The simpler model, where the coefficient(s) for the predictor(s) you are testing are constrained to be zero (i.e., they are removed from the model).
The LRT answers the question: Does the full model fit the data significantly better than the reduced model?
- Null Hypothesis (): The reduced model is sufficient (i.e., the predictor(s) we removed have no effect, ).
- Alternative Hypothesis (): The full model provides a significantly better fit (at least one of the removed predictors has an effect).
The test statistic, often called , is calculated from the log-likelihoods (or deviances) of the two models:
This can also be written as:
This statistic follows a chi-square () distribution with degrees of freedom equal to the number of parameters you removed to create the reduced model.
How to Use the LRT in Practice
To perform an LRT, you need the log-likelihood or deviance from both the full and reduced models.
This first resource explains the mechanics and shows how to interpret a "Deviance Table," which is a common way software presents LRT results.
12.1 - Logistic Regression | STAT 462
Let's return to the Penn State resource, which has an excellent section explaining the Likelihood Ratio Test and its connection to deviance.
Please read the section 'Likelihood Ratio (or Deviance) Test'. Focus on the formula and how the test statistic G² is calculated by subtracting the deviances. Look at the 'Deviance Table' and see how the p-value for 'LI' (0.004) leads to the conclusion that it's a significant predictor. Also, note the example at the end showing how to test a group of interaction terms by comparing a full and reduced model.
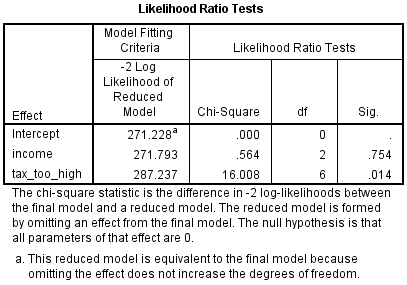
Sometimes, you may need to calculate the LRT statistic by hand from the output of two separate models. This next resource provides a clear, step-by-step example.
How are the likelihood ratio, Wald, and Lagrange multiplier (score) tests different and/or similar?
This FAQ from UCLA Stats provides a perfect, practical example of performing an LRT to test the joint significance of two predictors (math and science).
Please read the section 'The likelihood ratio test'. Follow the example where they compare Model 1 (reduced) to Model 2 (full). Trace how they take the log-likelihood from each model's output to calculate the final LR test statistic of 36.05.
Key Takeaway for the LRT: It is the standard method for testing the significance of a group of predictors (e.g., a categorical variable with 3+ levels, or a set of interaction terms) or for formally comparing any two nested models.
4. Exam Strategy: Wald vs. LRT
For your exam, you need to know which test to use and when. Here is a simple decision guide.
| Situation | Recommended Test | Why? |
|---|---|---|
| Testing a single predictor (continuous or binary) | Wald Test | It's the fastest method. The result is right in the main coefficient table of the model output. |
Testing multiple predictors at once (e.g., "Are age and income jointly significant?") |
Likelihood Ratio Test | This requires comparing the full model (with age and income) to a reduced model (without them). The Wald test is not designed for this type of joint hypothesis in the same way. |
| Testing a single categorical predictor with >2 levels | Likelihood Ratio Test | A categorical predictor with k levels is represented by k-1 dummy variables. To test the predictor's overall significance, you must test all k-1 coefficients simultaneously. This is a job for the LRT. |
| Comparing two specific nested models | Likelihood Ratio Test | By definition, this is what the LRT is designed for. |
While the tests are computationally different, for large samples, they will almost always lead to the same conclusion. The LRT is generally considered statistically superior, especially in smaller samples or when parameter estimates are large.
This final resource provides a superb summary comparing the tests, including a graphic that visually explains the difference.
How are the likelihood ratio, Wald, and Lagrange multiplier (score) tests different and/or similar?
Let's revisit the UCLA FAQ page for a final comparison of the tests. This will solidify your understanding.
First, quickly read the section on 'The Wald test' to see how it can also be used to test a joint hypothesis, confirming the conclusion from the LRT. Then, read 'A comparison of the three tests'. Pay close attention to the graphical representation, as it perfectly summarizes what each test is measuring.
Conclusion
You now have two powerful tools to formally assess the significance of predictors in a logistic regression model.
Key Takeaways:
- Wald Test: Used to test the significance of a single coefficient (). The test statistic is . The p-value is typically found in the main regression output table.
- Likelihood Ratio Test (LRT): Used to compare nested models. It's ideal for testing the joint significance of multiple predictors. The test statistic is and follows a distribution.
- Connection: A significant p-value from either test () corresponds to the finding from our last lesson: the 95% confidence interval for the odds ratio does not contain 1.
In our next and final lesson on logistic regression, we'll zoom out from individual predictors and look at the model as a whole. We will explore how to use the Pearson chi-square statistic to assess the overall goodness-of-fit of the model.