Hello! In our last lesson, we focused on interpreting logistic regression coefficients by converting them from the log-odds scale () to the more intuitive odds ratio scale (). This gave us a single number—a point estimate—of a predictor's effect.
However, a point estimate on its own doesn't tell the whole story. It's our best guess, but due to sampling variability, the true effect in the population is likely different. Today, we'll address this uncertainty by learning how to construct and interpret confidence intervals. This directly addresses the learning outcome: Construct a confidence interval for a regression coefficient and transform it into a confidence interval for an odds ratio.
This is a critical skill for your exam because it moves beyond simple interpretation to assessing statistical significance, which is a common requirement in application-based questions.
1. Constructing a Confidence Interval for the Coefficient ()
Just like in linear regression, we can construct a confidence interval around our estimated coefficient, . In logistic regression, we typically use a Wald confidence interval. The great news is that you won't need to calculate the standard error by hand; it's a standard part of any statistical software output.
The formula for a confidence interval for a coefficient is:
Where:
- is the estimated coefficient (the "Coef" or "Estimate" from your output).
- is the standard error of the coefficient (the "SE Coef" or "Std. Error").
- is the critical value from the standard normal distribution for the desired confidence level. For a 95% confidence interval (), this value is 1.96.
The following resource provides a clear explanation and shows where to find these values in a typical output table.
12.1 - Logistic Regression | STAT 462
This reading from Penn State's STAT 462 course formally introduces the Wald test and the formula for constructing a confidence interval for a regression coefficient.
Please read the text under the heading 'Wald Test'. Focus on the formula for the confidence interval and identify where the coefficient ('Coef') and standard error ('SE Coef') are located in the example output table for the predictor 'LI'.
2. From the Coefficient's CI to the Odds Ratio's CI
Once you have the confidence interval for the log-odds ratio (), converting it to a confidence interval for the odds ratio is straightforward. Because the exponential function is monotonic (it preserves order), you can simply exponentiate the lower and upper bounds of the interval for .
The Two-Step Process:
-
Calculate the CI for :
- Lower Bound:
- Upper Bound:
-
Exponentiate the bounds to get the CI for the Odds Ratio (OR):
- Lower Bound of OR CI:
- Upper Bound of OR CI:
This next resource provides a perfectly clear, worked example of this two-step process.
Unlock the First Steps to Binary Data Analysis
This guide from the University of Waterloo clearly demonstrates how to calculate the 95% CI for the log-odds ratio and then transform it into the 95% CI for the odds ratio.
Please read the section 'The 95% confidence intervals' (4.4.2). Follow the worked 'Example' for the tobacco covariate, which takes you from the coefficient and standard error all the way to the final confidence interval for the odds ratio.
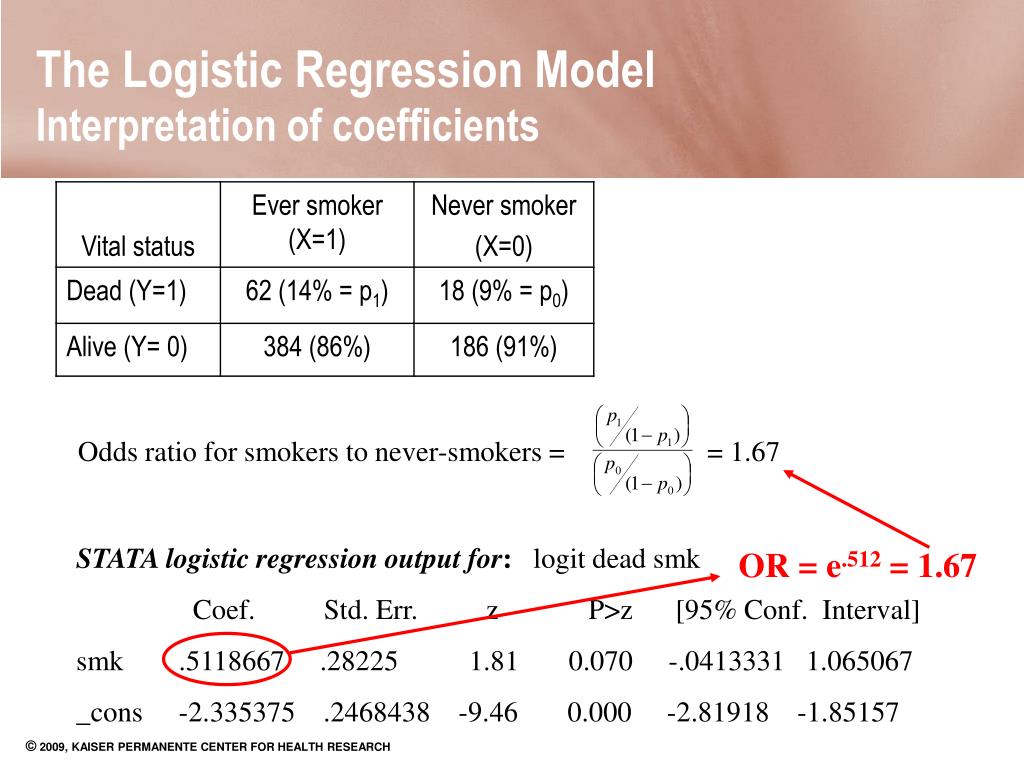
This image provides another excellent illustration, linking the raw data in a 2x2 table, the manual odds ratio calculation, and the corresponding logistic regression output from STATA, including the coefficient and its 95% CI.
3. Interpreting the Odds Ratio Confidence Interval
Now that you have the confidence interval for the odds ratio, how do you interpret it? The key is to check whether the interval contains the value 1. An odds ratio of 1 means there is no association between the predictor and the outcome (the odds are the same in both groups).
Here are the decision rules:
- If the entire CI is above 1: The association is statistically significant. The predictor is associated with an increased odds of the outcome.
- If the entire CI is below 1: The association is statistically significant. The predictor is associated with a decreased odds of the outcome (i.e., it's a "protective" factor).
- If the CI contains 1: The association is not statistically significant. You cannot conclude that there is an association between the predictor and the outcome based on your data.
The following video provides an excellent walkthrough of these three scenarios.
Interpreting confidence intervals for the odds ratio
This video from College Statistics offers a very practical guide to interpreting confidence intervals for odds ratios, which is a crucial skill for your exam.
Please watch the following segments: The Null Hypothesis (03:06 - 06:18): Understand why the number 1 is the critical value for interpretation. Interpreting Protective Factors (06:18 - 11:19): See examples where the odds ratio is less than 1 and learn to distinguish between a significant and non-significant protective effect. Interpreting Risk Factors (11:19 - 14:51): See examples where the odds ratio is greater than 1. Summary (17:27 - 18:26): A concise recap of the decision rules.
Here is an example of what a final odds ratio table might look like in a report. Notice how the CIs for 'Conservativeness' are entirely above 1 (significant risk), while the CIs for 'Establishmentness' are entirely below 1 (significant protection).

4. Advanced Application: CI for an Interaction Effect
For your exam, you might encounter a question that involves an interaction term. As we briefly mentioned in the last lesson, when a model includes an interaction (e.g., ), the log-odds ratio for one variable depends on the level of the other.
For example, the log-odds ratio for a one-unit increase in when might be . To find the confidence interval for this combined effect, you must first find its standard error, which requires using the variance-covariance matrix of the model's coefficients.
While this is more complex, the logic is an extension of what you've learned. The following resource shows exactly how to execute these steps.
Unlock the First Steps to Binary Data Analysis
Let's return to the University of Waterloo guide. This section provides a step-by-step example of how to calculate a confidence interval for an effect that involves an interaction term.
Read the 'Example' that begins 'Let’s look at estimating the odds ratio of CHD for a one unit increase in ldl...'. Focus on the three steps listed: 1. Find the SE manually, 2. Construct the CI for the logOR, and 3. Exponentiate. Don't worry about memorizing the R code, but understand the process of combining coefficients and using the variance-covariance matrix to find the new standard error before building the CI.
Conclusion
You have now learned how to quantify the uncertainty around your effect estimates in logistic regression. This is a crucial step in moving from "what is the effect?" to "how sure are we about this effect?".
Key Takeaways:
- The 95% Wald CI for a coefficient is calculated as .
- To get the CI for the odds ratio, you simply exponentiate the lower and upper bounds of the CI for .
- The interpretation of an odds ratio's CI hinges on whether it contains the value 1.
- CI > 1: Significant positive association (risk factor).
- CI < 1: Significant negative association (protective factor).
- CI contains 1: Not a statistically significant association.
In our next lesson, we will formalize the process of testing significance by exploring the Wald and Likelihood Ratio tests. You'll see how the conclusions from these formal hypothesis tests align perfectly with the interpretation of confidence intervals you learned today.