Hello! In our previous lesson, we focused on testing the significance of individual predictors in a logistic regression model using Wald and Likelihood Ratio tests. This is crucial for understanding which variables contribute meaningfully to your model.
Today, we will zoom out from individual components and evaluate the model as a whole. This lesson addresses our final topic on logistic regression: explaining the role of the Pearson chi-square statistic in assessing the goodness-of-fit of a logistic regression model.
Goodness-of-fit (GOF) asks a different question: Is the overall structure of our model adequate for the data? Or is there a significant "lack of fit," suggesting our model's predictions are systematically different from what we actually observed? For your exam, you'll need to interpret GOF statistics from software output to decide if a model is acceptable.
1. What Are We Testing with Goodness-of-Fit?
Before diving into a specific test, let's clarify what a GOF test is trying to achieve. While the Wald and Likelihood Ratio tests check if a specific coefficient is zero, a GOF test checks if the entire model is a reasonable representation of the data.
Essentially, all GOF tests for GLMs work by comparing your fitted model (the "proposed model") to a benchmark. The ultimate benchmark is a saturated model, which is a hypothetical model so complex that it fits the data perfectly. It has one parameter for every unique data point or group of data points, meaning its predictions match the observations exactly.
The difference between your proposed model's fit and the saturated model's perfect fit is measured by a statistic called deviance. A large deviance indicates that your model is far from a perfect fit.
To build a solid intuition for these concepts, please watch the following video from StatQuest.
This video, 'Saturated Models and Deviance' by Josh Starmer, provides a clear, visual explanation of the concepts that underpin goodness-of-fit testing. Focus on understanding the role of the saturated model as a 'best-case scenario'.
Watch the following segments: Introduction (00:35 - 01:40): Get an overview of the saturated model and deviance. The Saturated Model (03:33 - 05:18): Understand what a saturated model is and why its log-likelihood represents the best possible fit. Deviance (09:12 - 11:31): Learn how residual deviance measures the gap between your proposed model and the saturated model. Notice that this deviance statistic follows a chi-square distribution. Simplification for Logistic Regression (15:49 - 17:26): See why the log-likelihood of the saturated model is 0 in logistic regression, which simplifies the deviance calculation.
The key idea is that a goodness-of-fit test is essentially a hypothesis test on the model's deviance. The Pearson chi-square test is one of the most common ways to do this.
2. The Pearson Chi-Square Goodness-of-Fit Test
The Pearson chi-square GOF test formalizes the comparison between what your model predicts and what you observed.
- Null Hypothesis (): The model fits the data adequately. (The differences between observed and expected counts are due to random chance).
- Alternative Hypothesis (): The model does not fit the data adequately. (There is a significant lack of fit).
A crucial point to remember for your exam: For a GOF test, we want a large p-value (). A large p-value means we fail to reject the null hypothesis, which is good news—it means we have no evidence to say our model is a poor fit.
The "Classic" Case: Grouped Data
The Pearson chi-square test works by first grouping the data into profiles, where each profile is a unique combination of the predictor variables. For example, if your predictors were sex (male/female) and smoker (yes/no), you would have four profiles.
For each profile , the test compares the observed counts () to the expected counts predicted by the model (). The test statistic is:
This statistic follows a distribution. If the value is large, it means the observed and expected counts are far apart, leading to a small p-value and rejection of the model.
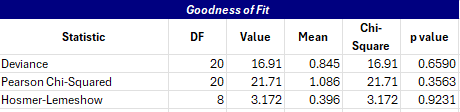
Let's see how to interpret this in practice.
The Complication: Continuous Predictors
The classic Pearson test relies on being able to group data into a manageable number of profiles. What happens if you have a continuous predictor like age or income? Each person will likely have a unique value, meaning each observation becomes its own profile. This situation is called unreplicated or ungrouped data.
When this happens, the assumptions behind the classic Pearson chi-square test break down, and its p-value is no longer reliable.
The following resources explain this distinction and what to do when the classic test is not appropriate.
12.1 - Logistic Regression | STAT 462
This first resource from Penn State's STAT 462 course gives a concise overview of GOF tests and highlights the critical issue of replicated vs. unreplicated data.
Read the section 'Goodness-of-Fit Tests'. Pay close attention to the first paragraph, which states that the Pearson chi-square test requires replicated data. In the example output, notice how they explicitly state that because the data is unreplicated, the Pearson and Deviance test results are invalid and should be ignored. This is a key insight for exam questions.
So, what do we do with ungrouped data? The most common alternative you'll see is the Hosmer-Lemeshow test. It works by grouping observations based on their predicted probabilities. However, as the next resource explains, this test has its own significant problems.
For your exam, you are not expected to be an expert on the nuances of these tests, but you should be aware of the problem with continuous predictors and know that the classic Pearson test is not the right tool in that case.
Measures of Fit for Logistic Regression
This paper, 'Measures of Fit for Logistic Regression' by Paul Allison, provides an expert take on the practical challenges of GOF testing. We'll focus on the sections explaining the Pearson test and its limitations.
Please read the following two sections: 'CLASSIC GOODNESS-OF-FIT STATISTICS': This provides a great summary of the Pearson chi-square test for grouped data (profiles). It reinforces the concept of comparing observed to expected counts. The following paragraphs: Continue reading into the next section where it explains why the Pearson test becomes problematic when you have continuous predictors and 'only one case per profile'. This clearly states why alternatives like the Hosmer-Lemeshow test were developed.
3. Exam Strategy: Interpreting Goodness-of-Fit
Here is a simple decision process for interpreting the Pearson GOF statistic on your exam.
-
Locate the Test: Find the "Goodness-of-Fit" section in the software output and identify the row for the "Pearson Chi-Square" test.
-
Check the P-Value:
- If : This is a good outcome. You conclude: "There is no evidence of a significant lack of fit." The model passes this diagnostic check.
- If : This is a bad outcome. You conclude: "The model shows a significant lack of fit." This suggests the model is misspecified. It might be missing important predictors, non-linear effects (e.g., a squared term), or interaction terms.
-
Check for Validity: Think about the predictors in the model.
- If all predictors are categorical: The data can be grouped into profiles. The classic Pearson GOF test is likely valid.
- If there is at least one continuous predictor: The data is ungrouped. The classic Pearson test is not valid. If you see a Pearson GOF test reported, it's either an invalid result or a special "standardized" version. More likely, the output will also provide an alternative like the Hosmer-Lemeshow test, which you should rely on instead.
Conclusion
You have now completed the core material on logistic regression! We've gone from interpreting coefficients and odds ratios to testing individual predictors and, finally, to assessing the overall model fit.
Key Takeaways:
- Purpose: The Pearson chi-square GOF test assesses the overall adequacy of a logistic regression model, answering "Does the model fit the data?"
- Hypothesis: The null hypothesis is that the model fits well. A high p-value () is desired.
- Mechanism: It compares the observed counts to the expected counts predicted by the model across different "profiles" (combinations of predictor values).
- Limitation: The classic Pearson GOF test is only valid for grouped data (i.e., when predictors are categorical). For models with continuous predictors, it is invalid, and alternative tests are needed.
Preview of the Next Lesson:
With all the analytical tools now covered, our final module will focus entirely on Exam Strategy and Application. We will work through practice problems that require you to integrate everything you've learned. The goal will be to look at a study description and quickly decide which method is appropriate: a contingency table analysis (like chi-square or Fisher's) or a GLM (like logistic regression), and then correctly interpret the results.