Welcome to the next lesson in our exploration of practical frameworks for problem-solving. In our previous sessions, we focused on defining a problem with Kidlin's Law and then prioritizing which problem to solve using the Eisenhower Matrix. Now, we turn to the crucial task of diagnosis. Once you've identified an important, complex problem, how do you systematically uncover its origins instead of just treating its symptoms?
This lesson introduces the Ishikawa Diagram, also known as a fishbone or cause-and-effect diagram. Your objective is to apply this visual tool to trace the root causes of a recurring bra fit complaint and to systematically identify the sources of recurring conflict in a vee relationship. This method provides a structured approach to brainstorming that moves beyond simple, linear causality, which is essential for the multifaceted challenges in both design and relationships.
The Anatomy of a Problem: The Ishikawa Diagram
The Ishikawa Diagram is a visual tool used to explore and categorize the potential causes of a problem. It was developed by Kaoru Ishikawa, a Japanese quality control expert, to help teams avoid overlooking potential factors in a complex situation. The problem itself forms the "head" of the fish, and the potential causes are grouped into categories that branch off like the bones of a skeleton.
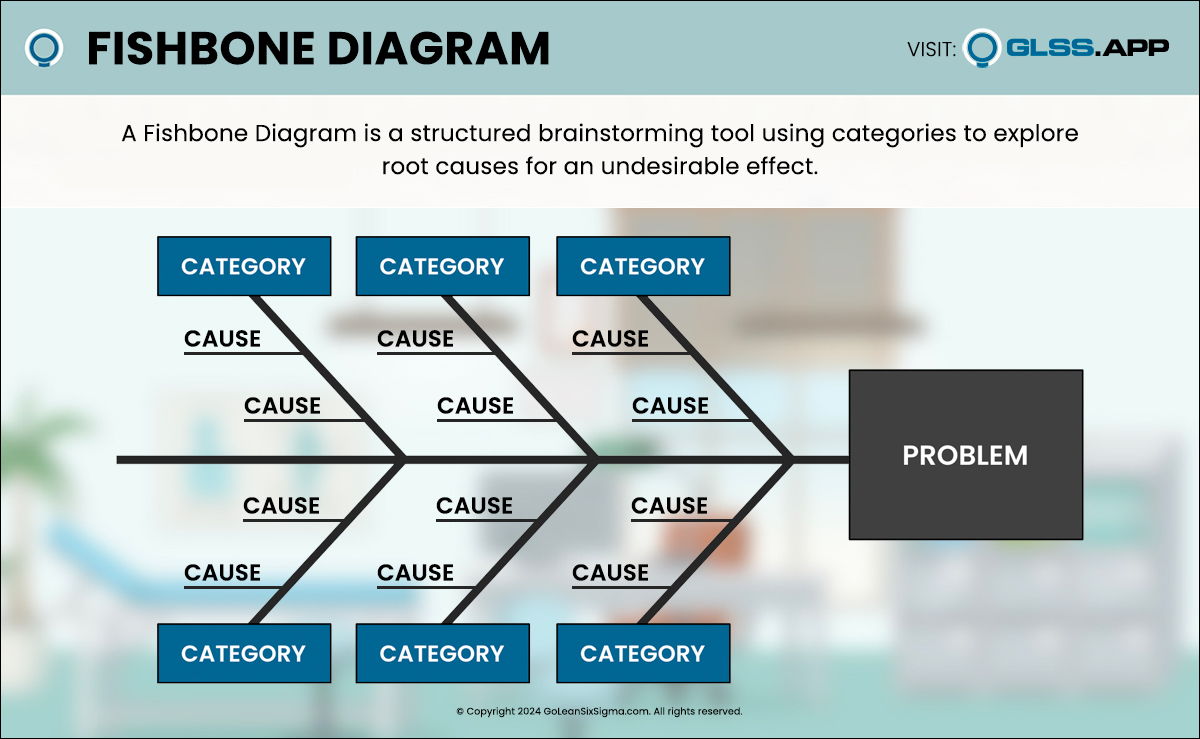
To get a quick and clear overview of how to construct and use this diagram, please watch the following short video.
Fishbone (Cause & Effect or Ishikawa Diagram)
This video from GEM Learning provides a concise, animated explanation of the Fishbone Diagram, its construction, and its purpose in problem-solving.
Watch the entire video (full duration). Pay close attention to: The setup of the diagram with the problem in the head. The examples of common cause categories used in manufacturing, such as people, equipment, technique, and materials. The process of classifying causes to guide subsequent action.
An important distinction for effective use is that the Ishikawa Diagram is primarily a brainstorming and categorization tool, not a final root cause analysis in itself. Its strength lies in ensuring you consider a wide range of possibilities before jumping to a conclusion. The following video explains this nuance well.
Don't use Fishbone diagram for Root Cause Analysis
This video from Tom Mentink provides a more advanced perspective, positioning the Ishikawa diagram as the first step in a larger root cause analysis process.
Watch the segment from the beginning to understand why the diagram is best used for identifying first-level causes. Next, watch the section explaining how the diagram helps broaden your scope and ensures all aspects of a problem are considered. Finally, see how the process logically leads to a next round of analysis, such as using the "5 Whys" method on the most probable causes you've identified.
With this framework in mind, let's apply it to your two areas of interest.
Application 1: Diagnosing a Recurring Bra Fit Complaint
A client repeatedly returns with the same issue: "No matter the style, the underwire always ends up digging into my ribs by the end of the day." This is a classic complex problem where the symptom (painful wire) could have numerous origins. Using an Ishikawa Diagram, we can systematically map out the potential causes.
The blog post "Adventures in Bra Sewing" by Doctor T Designs provides an excellent, detailed breakdown of common fit issues that we can use to populate our diagram.
Adventures in Bra Sewing: Figuring Out Fit Part 2 - Doctor T Designs
This article is a comprehensive diagnostic guide for bra fit issues. It's structured in a way that aligns perfectly with the categories of an Ishikawa diagram.
Skim the entire article to get a sense of the interconnectedness of bra fitting. As you do, focus on the specific lists of problems within each section, as these will become the "bones" of our diagram. Pay particular attention to the sections on the Frame and Band, the Bridge, the Wire Line, and the Cups. Notice how an issue in one area can manifest as a symptom in another.
Let's construct the diagram for the problem: "Underwire digs into ribs."
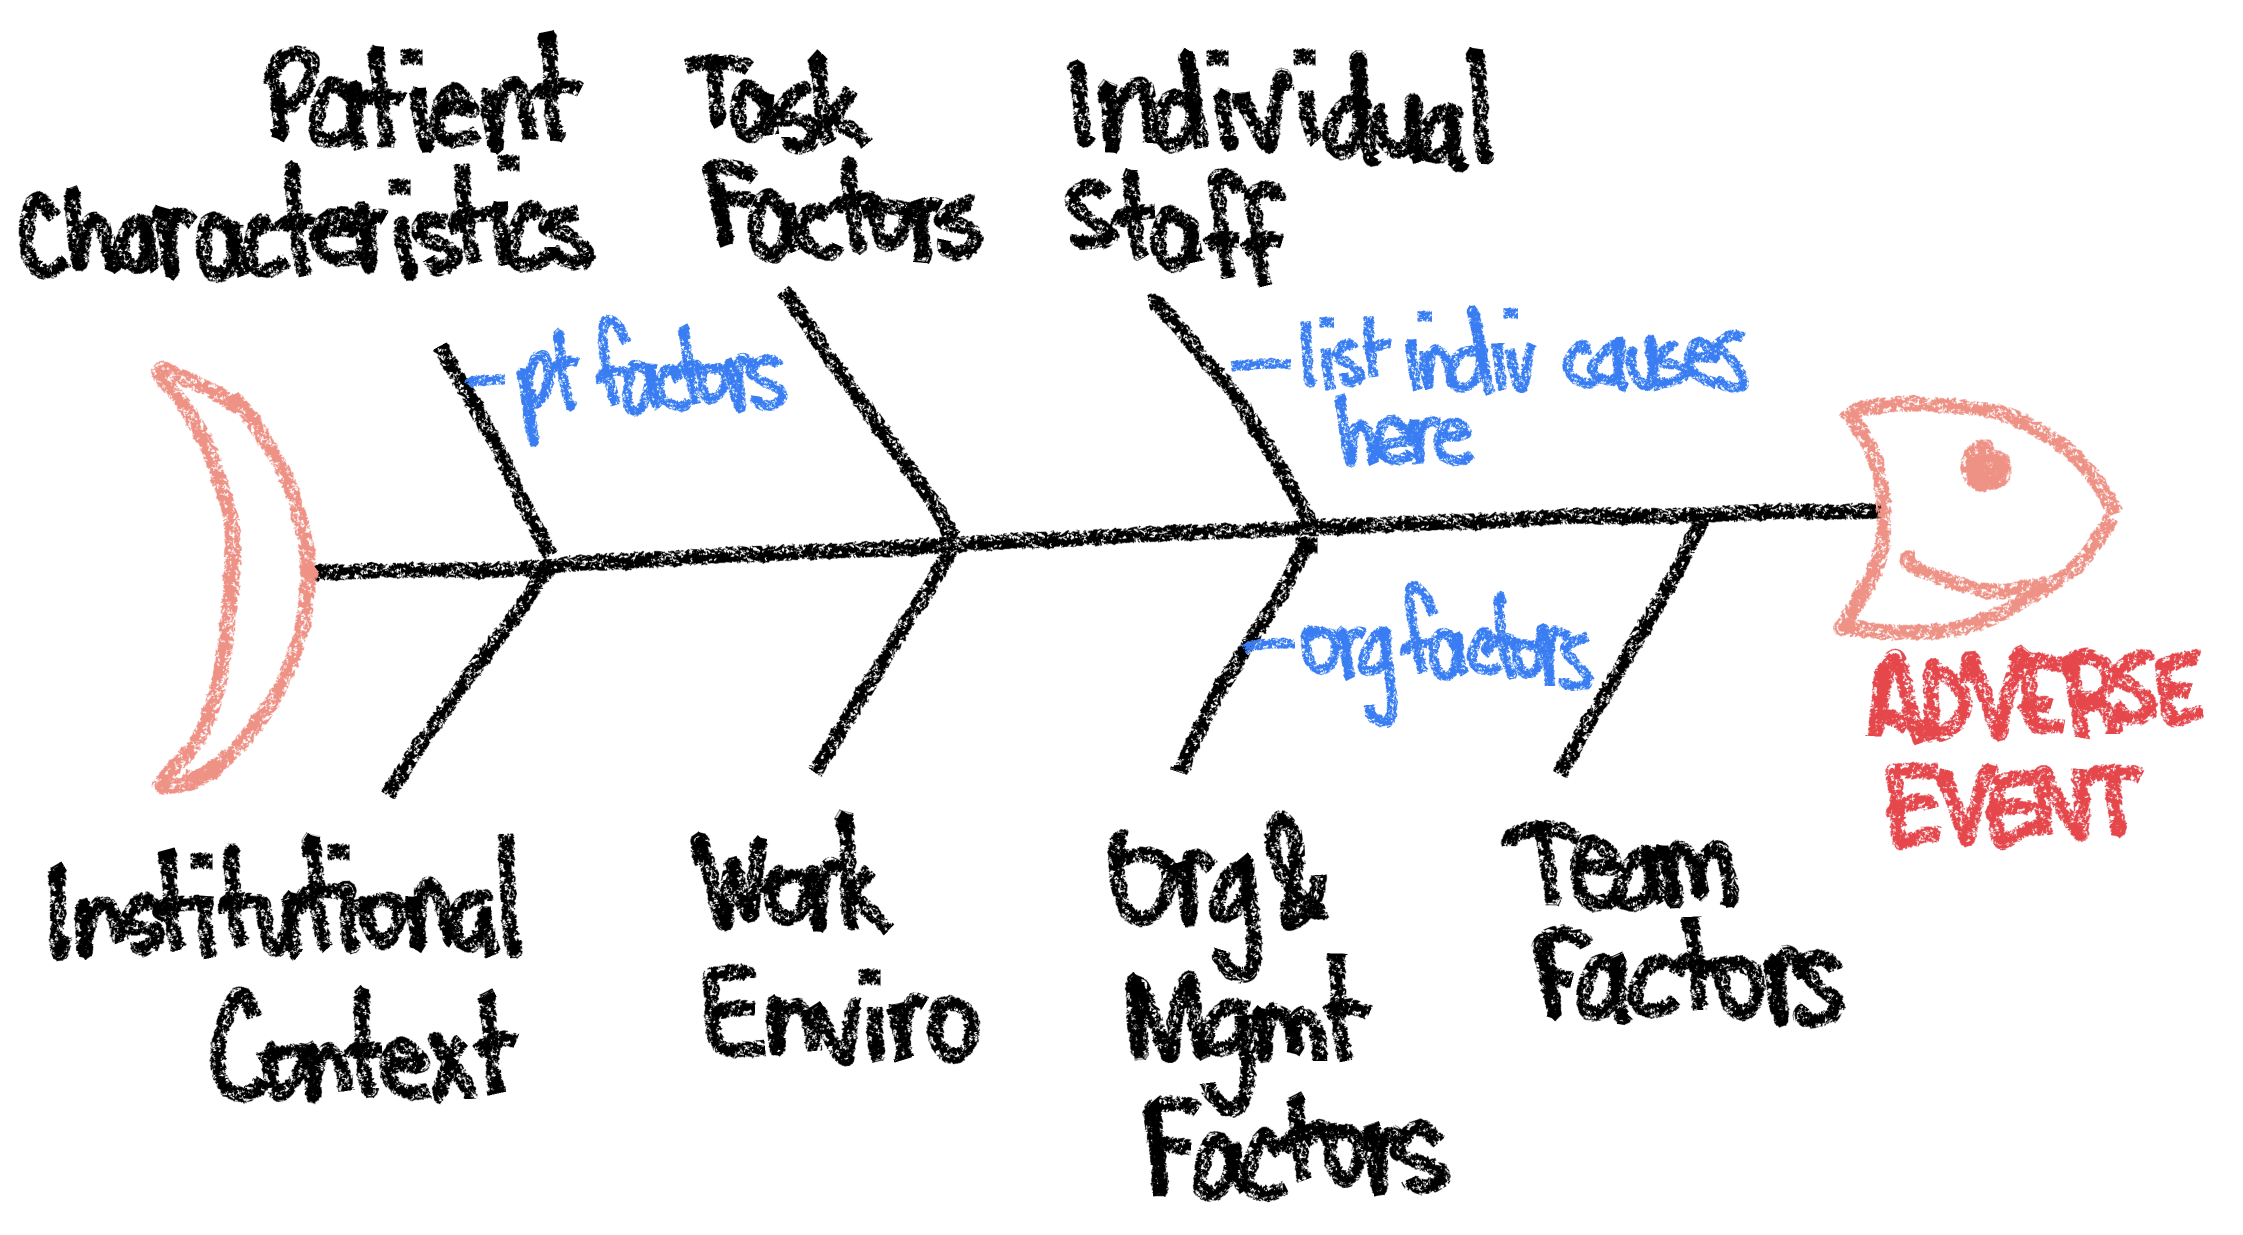
Head (Problem): Underwire digs into ribs.
Bones (Categories & Potential Causes):
-
Wire Line
- Wire size is too small, pressing on tissue which pushes the band down.
- Wire shape is wrong for the client's breast root (inframammary fold).
- Wire is too "sprung" (opened wider than its natural shape), creating pressure points.
- Wire gauge is too light, flexing and shifting during the day.
-
Band & Frame
- Band is too loose, failing to anchor the wires, allowing them to slide down onto the ribs.
- Band is too tight, pulling the wires with excessive tension against the body.
- Frame shape is wrong for the client's torso (e.g., a straight lower edge on a curved torso).
-
Bridge
- Bridge is too wide, causing the entire frame to sit away from the sternum and tilt forward.
- Bridge is too narrow, preventing the bra from tacking and causing it to shift down.
-
Cups
- Cup volume is too small, so breast tissue that can't fit in the cup pushes the whole bra down.
- Cup projection is too shallow, compressing the breast tissue, which then seeks space by pushing the bra down.
-
Client Anatomy
- The client has flared ribs, creating a hard pressure point where the band sits.
- The client has a prominent stomach, which pushes the bottom of the band upwards, causing the wire to dig in.
- The client has an "Omega" shape, requiring a smaller wire for the root but larger volume in the cup, a mismatch that can cause fit issues if not addressed.
This diagram transforms a vague complaint into a checklist of testable hypotheses. You can now go through this list with the client, checking each potential cause—examining the band fit, trying different wire sizes and shapes, and assessing her specific anatomy—to isolate the true root cause(s).
Application 2: Identifying Sources of Recurring Conflict in a Vee Relationship
Now let's apply the same logic to a relational problem. In our vee relationship, the wife (the hinge) and her husband find themselves in a recurring cycle of arguments about time, attention, and emotional energy. The problem statement is: "Recurring conflict between husband and wife over resource allocation (time/attention)."
As a social researcher, you are well-aware that such conflicts are rarely about the surface issue (e.g., "you spent too much time with your lover last night"). The Ishikawa diagram helps all parties look deeper. The SessionLab article on conflict management explicitly recommends this tool for this purpose.
29 conflict management techniques (that actually resolve issues!)
This article offers a toolkit for conflict resolution. We will focus on its explanation of Fishbone Analysis.
First, read the introduction on the importance of identifying the root cause. Then, study the specific section on Fishbone Analysis. Note its use in helping a group go deeper by brainstorming causes and subcategories together.
Let's build a diagram that the husband and wife could create together to diagnose their recurring conflict.
Head (Problem): Recurring conflict between husband and wife over resource allocation (time/attention).
Bones (Categories & Potential Causes):
-
Communication
- Implicit expectations are not being stated explicitly (e.g., assumptions about what "quality time" entails).
- Conversations are reactive (addressing a crisis) rather than proactive (checking in regularly).
- Use of blaming language ("You always...") instead of expressing personal feelings ("I feel...").
- Wife (hinge) is not clearly communicating her capacity limits, leading to burnout and resentment.
-
Agreements & Boundaries
- Original relationship agreements are now outdated or no longer fit the current situation.
- Boundaries around "couple time" vs. "individual time" are vague or porous.
- There is no clear, shared process for renegotiating agreements when needs change.
-
Individual Needs & Insecurities
- Husband's need for security and reassurance is not being adequately met.
- Wife's need for autonomy and self-care is being neglected.
- Both partners are experiencing external stress (work, family) that reduces their emotional capacity.
- Unacknowledged feelings of jealousy or "couple privilege" are influencing interactions.
-
Scheduling & Logistics
- Lack of a shared, visible calendar leads to double-booking and misunderstandings.
- The balance between planned time and spontaneous time is off, causing friction.
- "Passive" time (coexisting in the same house) is being conflated with "intentional" quality time.
-
Vee Structure Dynamics
- The emotional labor of managing the vee falls disproportionately on the wife (hinge).
- The husband feels like he is in a "second-place" position.
- Decisions are being made in dyads that affect the third person without their input.
By laying out the potential causes this way, the couple shifts from blaming each other to collaborating on a diagnosis. They can see that the issue is not a single failing but a complex system of interconnected factors. From here, they can pick one or two of the most resonant points (e.g., "We have vague agreements") and begin a more focused conversation about solutions.
Conclusion
The Ishikawa Diagram is a powerful analytical tool that forces a systematic and comprehensive approach to diagnosis. It prevents premature conclusions and encourages a deeper inquiry into the web of factors that create a complex problem.
Key Takeaways:
- An Ishikawa Diagram visually organizes potential causes of a problem into logical categories, resembling a fish skeleton.
- Its primary value is as a structured brainstorming tool to ensure a wide range of possibilities is considered.
- In lingerie design, it can turn a client's fit complaint into a diagnostic checklist of testable issues across the band, cups, wire, and client anatomy.
- In relationship dynamics, it can help partners collaboratively map out the interconnected causes of a recurring conflict, moving from blame to shared problem-solving.
- The output of an Ishikawa Diagram is not a final answer, but a set of validated hypotheses about the most likely causes, which can then be addressed.
Now that you have a tool to generate a broad list of potential causes, a new question arises: which one do you investigate first? In our next lesson, we will apply Sutton's Law, a principle that provides a strategic guide for where to focus your diagnostic efforts for the quickest and most effective results.