In our previous lesson, we established the core principle of Support Vector Machines: finding the optimal linear hyperplane that maximizes the margin between classes. We saw how a soft margin allows this model to handle noisy, but still mostly linear, data. However, the world is rarely so straightforward. Many real-world classification problems are fundamentally non-linear. This lesson addresses that challenge head-on.
Today, you will learn about the "kernel trick," the ingenious mathematical technique that gives SVMs their power and flexibility. We will explore how this trick allows SVMs to create complex, non-linear decision boundaries, effectively solving problems that are impossible for a linear classifier. You will understand the intuition behind common kernels, specifically the Polynomial and Radial Basis Function (RBF) kernels, and see how they work.
The Problem: When a Straight Line Isn't Enough
Linear SVMs are powerful, but they are limited to finding a linear decision boundary. What happens when your data looks like this?

As you can see, no straight line in the 2D plane can separate the red squares from the green circles. A linear model would fail. The intuitive solution, as shown in the image, is to project the data into a higher dimension. In this new, higher-dimensional space, the data might become linearly separable. A separating hyperplane in this new space, when projected back down to the original, lower-dimensional space, corresponds to a complex, non-linear decision boundary.
This concept of adding dimensions to make data separable is explained very clearly in the following video from StatQuest. It uses a simple 1D example that is impossible to separate but becomes trivial in 2D.
Support Vector Machines Part 1 (of 3): Main Ideas!!!
This video segment from StatQuest provides the foundational intuition for why we would want to project data into a higher dimension.
Watch the segment from the main idea behind SVMs. Pay close attention to how the 1D dosage data is transformed into 2D by adding a dosage^2 feature, which instantly makes the classes separable by a line.
The "Trick": Efficiency is Key
The idea of adding features to create a higher-dimensional space is not unique to SVMs. You could, for example, manually create new polynomial features (like , , , etc.) and then feed them into a linear model. However, this has two major drawbacks:
- Computational Cost: If you map your data to a very high-dimensional space, the number of computations can become enormous.
- Feature Selection: How do you know which transformation to apply? Should you use squared terms, cubic terms, or something else entirely?
This is where the genius of the kernel trick comes in. If you recall the SVM optimization problem from our last lesson, you'll remember that the algorithm's calculations (both for finding the hyperplane and for classifying new points) depend only on the dot product between pairs of data points ().
The kernel trick is based on a simple but powerful observation: we don't need to know the coordinates of our data in the high-dimensional space; we only need to know the dot products between them in that space.
A kernel is a function that takes two vectors in the original space, and , and returns the dot product of their images in the high-dimensional space, .
The "trick" is that we can compute this kernel function efficiently in the original, low-dimensional space, completely bypassing the expensive step of explicitly transforming the data.
The following short video explains this crucial concept succinctly.
The Kernel Trick in Support Vector Machine (SVM)
This video from the "Visually Explained" channel focuses directly on the kernel trick itself.
First, watch the setup which frames the problem and solution. Pay attention to the mention of the computational challenges of explicit transformation. The core idea is presented here: the SVM algorithm only needs the inner product of the transformed points, which is what the kernel provides. Finally, see how this enables the use of even infinite-dimensional transformations, like the RBF kernel, which would be impossible to compute directly.
Common Kernel Functions
Now that you understand what the kernel trick does, let's look at the two most common kernels you'll encounter. For this, we'll turn to a resource that lays out their mathematical form, which aligns with your goal of getting a "working understanding" of the math.
Support Vector Machines with Scikit-learn Tutorial
This article from DataCamp provides a concise breakdown of the most popular SVM kernels, including their formulas.
Read the section titled "SVM Kernels". As you read, focus on the formulas and descriptions for the Polynomial and RBF kernels.
Let's dissect what you just read:
1. Polynomial Kernel
The polynomial kernel is defined as:
This kernel essentially computes the dot product in a feature space composed of polynomials of degree up to .
d(degree): This is the key hyperparameter. It controls the flexibility of the decision boundary. A degree of 1 makes it a linear kernel. A higher degree like 2 or 3 allows for more complex, curved boundaries by implicitly creating interaction features (e.g., ) and polynomial features (e.g., ).r(coef0): This is a coefficient that trades off the influence of higher-order versus lower-order terms in the polynomial.γ(gamma): A scaling coefficient for the dot product.
2. Radial Basis Function (RBF) Kernel
The RBF kernel is the most popular choice for SVMs and is defined as:
As the video mentioned, the RBF kernel maps data to an infinite-dimensional space. This would be impossible without the kernel trick.
- Intuition: The RBF kernel can be thought of as a similarity measure. Its value is close to 1 if two points and are very close (i.e., the distance is small), and it decays towards 0 as the points get farther apart.
γ(gamma): This hyperparameter defines how much influence a single training example has.- A low
gammameans a large similarity radius, so points farther apart are considered similar. This results in a smoother, more general decision boundary. - A high
gammameans a small similarity radius. Only points very close to each other are considered similar. This can lead to a more complex, "wiggly" boundary that might overfit the training data.
- A low
Kernels in Action
The best way to understand the effect of different kernels is to see them in action. The following image shows four different kernels (Linear, RBF, Polynomial, Sigmoid) applied to three different non-linear datasets.
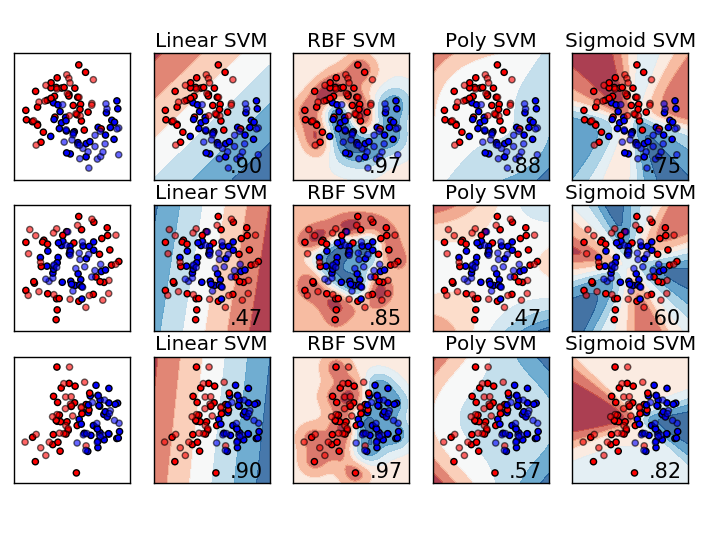
Look closely at the results:
- Top Row (Moons): The Linear SVM struggles. The RBF SVM creates a near-perfect boundary. The Polynomial SVM also finds a curved boundary but is less effective than RBF.
- Middle Row (Circles): This is a classic non-linear problem. The Linear and Polynomial SVMs fail completely, achieving an accuracy no better than random guessing. The RBF SVM, however, easily learns the circular boundary.
- Bottom Row: This is another complex boundary. Again, the RBF kernel proves to be the most flexible and effective.
This visual evidence highlights a key takeaway: the RBF kernel is an excellent default choice for SVMs when you don't have prior knowledge about your data's structure, due to its ability to handle a wide variety of non-linear patterns.
For a final summary, let's look at a clear comparison between the linear and non-linear approaches.
This article from GeeksforGeeks provides a helpful summary table comparing linear and non-linear SVMs.
Review the table under the heading "Linear SVM vs Non-Linear SVM". This will crystallize the key differences in your mind.
Conclusion
In this lesson, you've unlocked the true power of Support Vector Machines by understanding the kernel trick. You've moved beyond simple linear boundaries and can now see how SVMs tackle complex, real-world classification tasks.
Key Takeaways:
- When data is not linearly separable, SVMs can project it into a higher-dimensional space where a separating hyperplane might exist.
- The kernel trick is a highly efficient method that computes the relationships (dot products) between points in this high-dimensional space without ever explicitly performing the costly transformation.
- The Polynomial kernel creates polynomial decision boundaries, with the
degreehyperparameter controlling complexity. - The RBF kernel is a powerful, general-purpose kernel that can create highly complex boundaries. Its
gammahyperparameter controls the influence of individual data points, managing the tradeoff between a smooth and a complex decision boundary. - The choice of kernel and its hyperparameters is critical for the SVM's performance and depends on the underlying structure of the data.
In our next lesson, we will step back and evaluate the SVM algorithm as a whole. Now that you understand both its linear and non-linear capabilities, we will discuss its primary strengths and weaknesses, its sensitivity to things like feature scaling, and when you should choose it over other models like Logistic Regression or Random Forests.