In our last session, you learned how to construct and interpret a confusion matrix, breaking down a model's predictions into True Positives, True Negatives, False Positives, and False Negatives. This provided a detailed, qualitative look at model performance. Now, we will build directly on that foundation to quantify performance using a suite of essential metrics.
This lesson focuses on computing and interpreting four of the most important metrics in classification: accuracy, precision, recall, and the F1-score. You will learn not only what each metric measures but also why a single metric is rarely enough. A central theme will be the inherent precision-recall tradeoff, a fundamental concept you must master to tune classifiers effectively for real-world problems.
From Counts to Metrics
The confusion matrix gives us the raw counts of our model's successes and failures. Let's turn those counts into meaningful performance indicators.
Accuracy: The Intuitive but Deceiving Metric
Accuracy is the most straightforward metric. It answers the simple question: "What fraction of predictions did the model get right?"
It's calculated by dividing the number of correct predictions (TP + TN) by the total number of predictions.
While simple, accuracy can be very misleading, especially when dealing with imbalanced datasets. As we discussed previously, a model that predicts the majority class every time can achieve high accuracy while being completely useless.
The following video provides an excellent summary of why accuracy is often an inadequate measure of performance.
Precision, Recall, & F1 Score Intuitively Explained
This video from Scarlett's Log intuitively explains the concept of accuracy and its significant shortcomings.
Watch the segment from the definition of accuracy to the end of the discussion on biased datasets. Pay close attention to the example of a model achieving 99% accuracy by simply guessing the majority class.
The limitations of accuracy force us to look for metrics that tell us more about the types of errors our model is making. This is where precision and recall come in.
Precision and Recall: Quality vs. Coverage
Precision and recall are two of the most important classification metrics, each offering a different perspective on your model's performance, particularly concerning the positive class.
The image below provides a great visual summary of how precision and recall are calculated from the confusion matrix components.
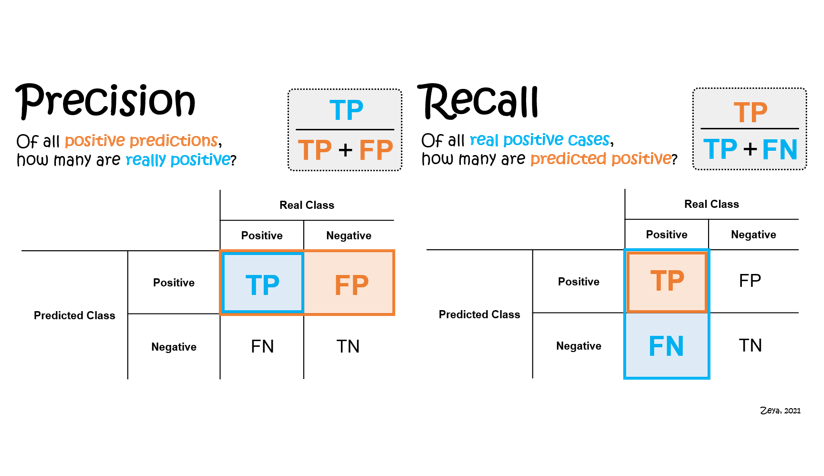
Let's break them down.
Precision Recall Curves - The Ultimate Guide
This blog post from Train in Data offers clear, concise definitions for precision and recall, along with helpful guiding questions.
Please read the sections on Precision and on Recall. As you read, focus on the question each metric answers.
As you've just read, we can summarize the two metrics as follows:
-
Precision: Answers the question, "Of all the instances the model predicted as positive, how many were actually positive?" It measures the quality of the positive predictions.
- When is it important? When the cost of a False Positive is high. For example, in an email spam filter, you want high precision. You would rather a few spam emails get into the inbox (low recall) than have an important email incorrectly marked as spam (a false positive).
-
Recall: Answers the question, "Of all the actual positive instances, how many did the model correctly identify?" It measures the completeness or coverage of the positive predictions. It is also known as Sensitivity or True Positive Rate (TPR).
- When is it important? When the cost of a False Negative is high. In medical diagnostics for a serious disease, you want high recall. You need to identify as many true positive cases as possible, even if it means some healthy patients are flagged for further testing (more false positives, lower precision).
The F1-Score: Finding a Balance
In many situations, you care about both precision and recall. The F1-Score is a metric designed to provide a single number that balances both. It is the harmonic mean of precision and recall.
A key question you might have is: why the harmonic mean and not a simple average? The harmonic mean heavily penalizes models where one of precision or recall is very low. A model with perfect precision (1.0) but zero recall (0.0) would have a simple average of 0.5, suggesting it's moderately useful. However, its F1-score would be 0, correctly reflecting that the model is failing at its task.
This video provides a superb explanation of this very point.
Precision, Recall, & F1 Score Intuitively Explained
This segment from Scarlett's Log clearly explains why the F1-Score uses a harmonic mean to balance precision and recall.
Watch the section from the introduction of the F1-score. Focus on the explanation of why a harmonic mean is used instead of a simple arithmetic average.
Computing the Metrics: A Practical Example
Now that you understand the definitions, let's walk through how to compute these values from a confusion matrix.
The following article demonstrates this perfectly using the Wisconsin Breast Cancer dataset, a classic machine learning case study.
Confusion Matrix Made Simple: Accuracy, Precision, Recall ...
This article from Towards Data Science provides a concrete example of calculating all four metrics from the values in a confusion matrix.
Read the section that begins with the confusion matrix values. Follow the calculations for Accuracy, Precision, Recall, and F1-score. This will solidify how the formulas you've learned are applied to raw numbers.
The Precision-Recall Tradeoff
You will rarely find a model that has both perfect precision and perfect recall. In practice, they exist in a trade-off: improving one often comes at the cost of the other. This relationship is one of the most important concepts in classifier evaluation.
The "knob" you can turn to navigate this tradeoff is the classification threshold. Recall that a logistic regression model outputs a probability between 0 and 1. By default, scikit-learn uses a threshold of 0.5 to classify an instance as positive.
- Increasing the threshold (e.g., to 0.9) makes the model more "strict." It will only predict positive if it's very confident. This leads to fewer False Positives (higher precision) but more False Negatives (lower recall).
- Lowering the threshold (e.g., to 0.2) makes the model more "lenient." It will predict positive more easily. This leads to fewer False Negatives (higher recall) but more False Positives (lower precision).
The following reading explains this crucial dynamic.
Precision Recall Curves - The Ultimate Guide
This article continues the diabetes prediction example to explain how adjusting the classification threshold creates the tradeoff between precision and recall.
Please read the entire section titled Precision Recall Tradeoff. Pay special attention to the discussion of how higher and lower thresholds influence the metrics.
This tradeoff is visualized beautifully in the plot below. As the classification threshold changes, you can see precision and recall moving in opposite directions. The F1-score, which balances the two, often reaches a peak at a certain threshold, which may be the optimal setting for a balanced problem.

The decision of where to set this threshold is not a purely technical one; it depends on the business or research context. For spam detection, you prioritize precision. For cancer detection, you prioritize recall.
Metrics in Practice with Python
Your proficiency with Python and scikit-learn will make applying these concepts straightforward. You don't need to calculate these metrics manually every time. The classification_report function from sklearn.metrics provides a comprehensive summary.
The codebasics video you saw in the previous lesson also covers this. Watching this short segment again will connect the theory directly to the Python output you'll be using constantly.
Precision, Recall, F1 score, True Positive|Deep Learning Tutorial 19 (Tensorflow2.0, Keras & Python)
This segment from the codebasics channel shows how to generate and interpret scikit-learn's classification_report.
Watch the clip from the demonstration of the classification_report. Notice how it provides precision, recall, and f1-score for each class, along with the overall accuracy.
Conclusion
In this lesson, you have moved from the raw counts of a confusion matrix to a powerful suite of quantitative metrics. You now have the vocabulary and the conceptual framework to evaluate and discuss a classifier's performance with nuance and precision.
Key Takeaways:
- Accuracy is intuitive but can be misleading, especially with imbalanced data.
- Precision measures the quality of positive predictions, answering "How many of our positive predictions were correct?" It is critical when False Positives are costly.
- Recall measures the completeness of predictions, answering "How many of the actual positive cases did we find?" It is critical when False Negatives are costly.
- The F1-Score is the harmonic mean of precision and recall, providing a single metric that balances both.
- The Precision-Recall Tradeoff is a fundamental tension in classification, managed by adjusting the classification threshold. The optimal balance depends on your specific problem.
You are now well-equipped to evaluate a classification model. In our next lesson, we will explore another powerful evaluation tool: the Receiver Operating Characteristic (ROC) curve and the Area Under the Curve (AUC). These will provide you with a way to visualize a model's performance across all possible thresholds and offer a robust method for comparing different models.