Hello! In our last session, we explored how to evaluate a classification model at a specific decision threshold using metrics like precision, recall, and F1-score. We saw that adjusting this threshold creates a fundamental tradeoff, particularly between precision and recall.
This lesson introduces a powerful tool that allows us to see the full picture: the Receiver Operating Characteristic (ROC) curve. Instead of evaluating the model at just one point, the ROC curve visualizes its performance across all possible classification thresholds. We will then learn to distill this entire curve into a single, powerful metric: the Area Under the Curve (AUC). This will complete your core toolkit for evaluating and comparing classification models.
From Thresholds to a Curve
In the previous lesson, the central idea was that a logistic regression model outputs probabilities, and we apply a threshold (like 0.5) to make a binary classification. The ROC curve is generated by plotting the model's performance at every conceivable threshold, not just one.
The best way to build intuition for this is to see it constructed step-by-step. The following video from StatQuest does an exceptional job of this.
ROC and AUC, Clearly Explained!
This StatQuest video, "ROC and AUC, Clearly Explained!", builds the concept of an ROC curve from the ground up, starting with logistic regression probabilities and moving point-by-point as the threshold changes.
Please watch these three segments: First, review how a classification threshold turns probabilities into classes. Next, understand the axes of the ROC graph: the True Positive Rate and False Positive Rate. Finally, watch the detailed walkthrough of how the curve is constructed by plotting points for different thresholds.
As you just saw, an ROC curve is a two-dimensional plot with two key rates on its axes:
-
Y-axis: True Positive Rate (TPR). This is the exact same metric as Recall or Sensitivity, which you already know. It answers: Of all the actual positive instances, what fraction did the model correctly identify?
-
X-axis: False Positive Rate (FPR). This metric might be new. It answers: Of all the actual negative instances, what fraction did the model incorrectly classify as positive?
The ROC curve visualizes the tradeoff between these two metrics. As you lower the classification threshold to capture more true positives (increasing TPR), you inevitably also misclassify more negatives as positive (increasing FPR).

Interpreting the ROC Curve and AUC
Now that you understand how an ROC curve is built, let's focus on how to interpret it. A model's curve tells a story about its ability to separate the positive and negative classes.
Interpreting ROC Curve and ROC AUC for Classification ...
This article from Towards Data Science provides excellent visual examples for interpreting the shape of an ROC curve and how it relates to the separation of class probability distributions.
Please read the section titled Interpreting the ROC Curve. Pay close attention to the diagrams that compare a bad, good-enough, and good classifier's ROC curve with its corresponding class distribution histograms.
As the reading highlights, we can summarize the interpretation as follows:
- Random Guess Line: The diagonal line from (0,0) to (1,1) represents a classifier with no predictive power—it's equivalent to random guessing. A model whose curve falls on this line has a TPR equal to its FPR.
- Perfect Classifier: The point (0,1) represents a perfect classifier: it achieves a 100% True Positive Rate with a 0% False Positive Rate. An effective model will have a curve that "bows" up towards this top-left corner.
- Model Comparison: The closer a curve follows the top-left border of the plot, the better the model. If you are comparing two models, the one whose curve is consistently higher and to the left is superior.
While visually comparing curves is useful, it's often more practical to summarize a curve's performance with a single number. This is the Area Under the (ROC) Curve, or AUC.
ROC AUC Explained: A Beginner's Guide to Evaluating ...
The Area Under the Curve (AUC) is the shaded region under the ROC curve. It provides a single value summarizing the model's performance across all thresholds.
The AUC score has a range:
- AUC = 1.0: A perfect classifier.
- AUC = 0.5: A classifier with no predictive value (same as random guessing).
- AUC < 0.5: A classifier that is worse than random guessing. (This is rare; it often indicates a bug or that the model's predictions are inverted).
A powerful and intuitive way to understand AUC is through its probabilistic interpretation.
ROC AUC Explained: A Beginner's Guide to Evaluating ...
This article provides an excellent, non-technical definition of AUC and demonstrates its calculation.
First, read the brief subsection that starts with An AUC of 0.81 to grasp the core probabilistic interpretation. Then, read the section that begins with the second calculation method. This "Ranking Method" directly illustrates the probabilistic meaning and is a much more intuitive way to think about what AUC represents than the geometric (trapezoidal) method.
As you've just read, the AUC has a wonderfully elegant meaning:
AUC is the probability that the model will rank a randomly chosen positive instance higher than a randomly chosen negative instance.
An AUC of 0.85 means that if you pick one random positive example and one random negative example, there is an 85% chance that your model assigned a higher probability score to the positive example. This interpretation makes AUC a measure of how well the model separates the two classes.
ROC and AUC in Python
Given your background, you'll find implementing this in scikit-learn very direct. The sklearn.metrics module provides all the necessary functions.
It's crucial to remember that to generate a smooth, accurate ROC curve, you must use the predicted probabilities from your model, not the final 0/1 classifications.
Interpreting ROC Curve and ROC AUC for Classification ...
This article provides the code for calculating AUC and plotting the curve with scikit-learn.
First, read the short section on ROC AUC to see how roc_auc_score is used. Then, jump to the section on plotting with scikit-learn. Note the important difference in the resulting plots when using predict_proba() versus predict().
Here is a summary of the key functions you will use from sklearn.metrics:
roc_curve(y_true, y_probabilities): This function computes the TPR and FPR for various thresholds. It returns three arrays:fpr,tpr, andthresholds.roc_auc_score(y_true, y_probabilities): This function directly computes the Area Under the Curve.RocCurveDisplay.from_estimator(model, X_test, y_test)orRocCurveDisplay.from_predictions(y_test, y_probabilities): These are convenient plotting functions that handle theroc_curvecalculation and plotting withmatplotlibin one step.
Here is a typical implementation pattern:
from sklearn.datasets import make_classification
from sklearn.model_selection import train_test_split
from sklearn.linear_model import LogisticRegression
from sklearn.metrics import roc_curve, roc_auc_score, RocCurveDisplay
import matplotlib.pyplot as plt


# Generate data and train a model
X, y = make_classification(n_samples=1000, n_features=10, random_state=42)
X_train, X_test, y_train, y_test = train_test_split(X, y, test_size=0.2, random_state=42)

model = LogisticRegression()
model.fit(X_train, y_train)


# Get predicted probabilities for the positive class
y_probs = model.predict_proba(X_test)[:, 1]


# 1. Calculate AUC
auc = roc_auc_score(y_test, y_probs)
print(f'AUC: {auc:.4f}')


# 2. Get the ROC curve points
fpr, tpr, thresholds = roc_curve(y_test, y_probs)


# 3. Plotting with RocCurveDisplay (the easy way)
RocCurveDisplay.from_predictions(y_test, y_probs)
plt.plot([0, 1], [0, 1], 'k--', label='Random Guess') # Add the random guess line
plt.title('ROC Curve')
plt.show()
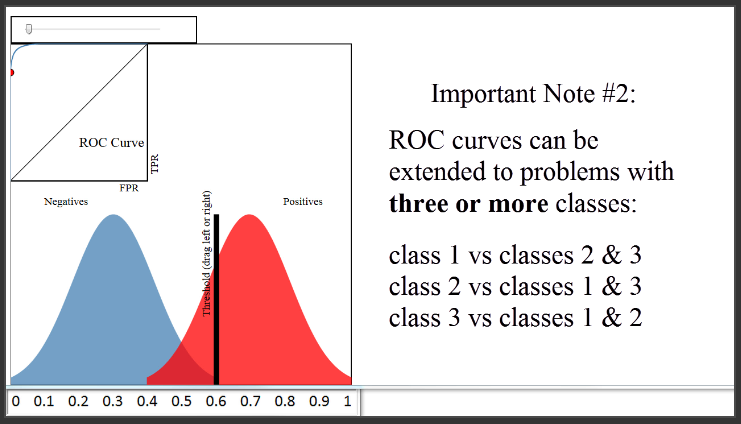
Finally, this concept can be extended to multi-class problems, typically by using a "one-vs-rest" (OvR) approach, where you plot a separate ROC curve for each class against all other classes.
Conclusion
You have now added the final, essential visualization and metric to your classification evaluation toolkit. You can now assess a model not just at a single point, but across its entire operational range.
Key Takeaways:
- The ROC curve plots the True Positive Rate (Recall) against the False Positive Rate at all possible classification thresholds.
- An effective model's curve bows towards the top-left corner (TPR=1, FPR=0), while a random model follows the diagonal line.
- The Area Under the Curve (AUC) quantifies the model's overall ability to discriminate between positive and negative classes into a single value between 0.5 and 1.0.
- Intuitively, AUC represents the probability that the model will assign a higher score to a randomly chosen positive instance than to a randomly chosen negative one.
- In
scikit-learn, always use the output ofpredict_proba()to generate smooth and meaningful ROC curves.
In our next lesson, we will synthesize everything from this module. You will apply logistic regression to a real-world binary classification problem and perform a comprehensive evaluation using the confusion matrix, precision, recall, F1-score, and now, ROC/AUC. We will also formally discuss how to extend logistic regression to multi-class scenarios.