Welcome to the practical culmination of our module on logistic regression. Over the past few lessons, we've built a strong theoretical foundation, covering everything from the sigmoid function and decision boundaries to a full suite of evaluation tools: the confusion matrix, precision, recall, F1-score, and the comprehensive ROC curve with its AUC metric.
Today, we will put all that theory into practice. Your goal for this lesson is to apply logistic regression to a real-world binary classification problem, from data preparation to a thorough model evaluation. This hands-on exercise will solidify your understanding of the entire workflow and demonstrate how to critically assess a model's performance in a realistic context. This directly aligns with your goal of having a practical application for every algorithm we study.
A Complete Workflow: From Data to Evaluation
We will build a model to predict whether a breast cancer tumor is malignant or benign based on various cell measurements. This is a classic binary classification problem where the stakes are high, making a nuanced evaluation of the model's errors particularly important.
The GeeksForGeeks article, "Logistic Regression using Python," provides an exceptionally clear, step-by-step guide for this exact task. We will follow its structure to load the data, preprocess it, train our model, and evaluate its performance.
Logistic Regression using Python
This first part of the tutorial walks you through setting up the project. It covers loading the dataset, converting it to a pandas DataFrame, splitting it for training and testing, and applying feature scaling.
Please read from the beginning of Step 1 through the end of Step 5. As you read, pay close attention to the following: Step 2: The dataset is load_breast_cancer, which is conveniently included with scikit-learn. Step 4: The use of train_test_split to prevent data leakage, a concept we covered in Module 2. Step 5: The application of StandardScaler. The article correctly notes that logistic regression benefits from feature scaling because its optimization algorithm (gradient descent) is sensitive to feature magnitudes.
Let's summarize the setup process you just reviewed. The standard workflow is:
- Load Data: Bring the dataset into our environment.
- Separate X and y: Isolate the features (X) from the target variable (y).
- Split Data: Divide X and y into training and testing sets. This is crucial to ensure we evaluate the model on data it has never seen before.
- Scale Features: Standardize the feature values. We fit the scaler only on the training data (
X_train) and then use that same fitted scaler to transform both the training and testing data (X_trainandX_test). This prevents information from the test set from "leaking" into the training process.
Training the Model and Making Predictions
With our data prepared and split, the next steps are to train the logistic regression model and use it to make predictions on our held-out test set.
Logistic Regression using Python
These next two steps in the GeeksForGeeks article cover the core modeling phase.
Please read Steps 6 and 7. You'll see the instantiation of LogisticRegression from sklearn.linear_model and the use of the .fit() and .predict() methods.
As you saw, the process in scikit-learn is remarkably direct:
- Instantiate:
model = LogisticRegression()creates an instance of the model. - Train:
model.fit(X_train, y_train)trains the model by finding the optimal coefficients for the features inX_trainto predicty_train. - Predict:
y_pred = model.predict(X_test)uses the trained model to generate class labels (0 or 1) for the unseen test data.
To perform a complete evaluation, especially for plotting the ROC curve, we also need the predicted probabilities. We can get these using:
# Probabilities for the positive class (e.g., 'malignant')
y_probabilities = model.predict_proba(X_test)[:, 1]
Evaluating Model Performance: A Multi-Faceted Approach
Now comes the most critical part: evaluating our model's performance. A single metric like accuracy can be misleading, especially with imbalanced datasets. Therefore, we will use the full suite of metrics we've learned.
The Confusion Matrix
The confusion matrix is the foundation of classification evaluation, giving us a raw count of correct and incorrect predictions.
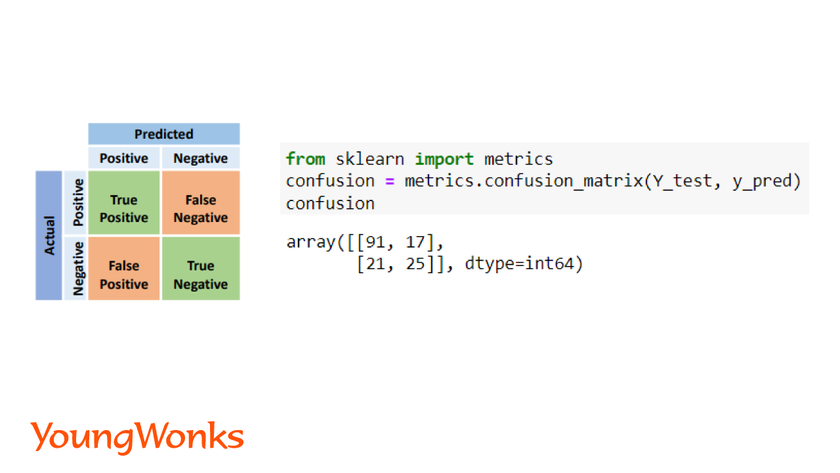
Let's look at the specific metrics derived from the matrix. The GeeksForGeeks article provides a fantastic, code-driven overview of this entire evaluation process.
Logistic Regression using Python
This final section of the article is dedicated to a comprehensive model evaluation, implementing all the key metrics we've discussed.
Please read all of Step 8. This section provides the scikit-learn code and a brief description for: Accuracy Score Confusion Matrix Precision, Recall, and F1 Score ROC-AUC Score and Curve Plotting
Let's digest the results from the article and interpret them in the context of our cancer prediction problem.
-
Confusion Matrix:
- True Positives (TP): The model correctly identified a tumor as malignant.
- True Negatives (TN): The model correctly identified a tumor as benign.
- False Positives (FP) (Type I Error): The model incorrectly classified a benign tumor as malignant. This would cause unnecessary stress and further testing for the patient.
- False Negatives (FN) (Type II Error): The model incorrectly classified a malignant tumor as benign. This is the most dangerous error, as a patient with cancer might be told they are healthy, delaying critical treatment.
-
Precision, Recall, and F1-Score: The
classification_reportinscikit-learnprovides these metrics.- Recall (Sensitivity or TPR): For the "malignant" class, this answers: "Of all the patients who truly had a malignant tumor, what percentage did our model correctly identify?" In a medical context, we want this to be as high as possible to minimize false negatives.
- Precision: For the "malignant" class, this answers: "Of all the patients our model flagged as having a malignant tumor, what percentage actually did?" High precision reduces the number of false alarms (false positives).
- F1-Score: The harmonic mean of precision and recall, providing a single score that balances both concerns.
-
ROC Curve and AUC:
- The ROC curve visualizes the trade-off between the True Positive Rate (Recall) and the False Positive Rate across all possible thresholds.
- The AUC score gives us a single number summarizing the model's ability to distinguish between the two classes. An AUC of 0.98, as seen in the article, indicates an excellent ability to separate malignant from benign cases. It means there is a 98% chance that the model will assign a higher probability score to a randomly chosen malignant tumor than to a randomly chosen benign one.
Alternative Walkthrough: The Pima Diabetes Dataset
The workflow we just followed is highly generalizable. To prove this, you can review another excellent tutorial from DataCamp that applies the exact same principles to a different medical dataset: predicting diabetes.
Python Logistic Regression Tutorial with Sklearn & Scikit
This DataCamp tutorial provides another complete, end-to-end example of applying and evaluating a logistic regression model.
Feel free to read through the sections on model building and evaluation. You will notice the exact same pattern: Load and prepare data. Split into training and testing sets. Instantiate and fit a LogisticRegression model. Evaluate using a confusion matrix, classification_report (for precision/recall), and ROC/AUC. This reinforces that the process is a standard, repeatable methodology in machine learning.
Conclusion
In this lesson, you have consolidated all the theoretical concepts from this module into a single, practical workflow. You have successfully trained a logistic regression classifier on a real-world dataset and, more importantly, performed a robust evaluation using a complete set of metrics.
Key Takeaways:
- A standard machine learning workflow for classification involves data preprocessing (scaling), train-test splitting, model training, and prediction.
- Evaluating a classification model requires a suite of metrics, not just accuracy.
- The confusion matrix provides the raw data for evaluation, breaking down predictions into TP, TN, FP, and FN.
- Precision and Recall measure different aspects of a model's performance, and the context of the problem (e.g., the cost of false negatives in medical diagnosis) dictates which is more important.
- The ROC curve and AUC provide a threshold-independent measure of your model's ability to discriminate between classes.
We have focused exclusively on binary classification. In our next lesson, we will explore how logistic regression can be extended to handle problems with more than two classes, using strategies like One-vs-Rest (OvR) and the softmax function.