Hello! In our last lesson, we learned how to manage system services with systemctl, giving you control over what programs run on your system and when. That was about issuing commands. Now, we'll focus on listening to what the system is telling us.
Understanding system logs is a critical skill for any cybersecurity professional. For a system administrator, logs are essential for troubleshooting. For an ethical hacker, they are a goldmine of information for reconnaissance, identifying misconfigurations, and understanding system behavior.
This lesson will address the learning outcome: Read and search system logs using journalctl and log files in /var/log. We will explore the two primary logging systems found in modern Linux distributions like your Arch Linux system, learning how to query them effectively to find the information you need.
The Two Worlds of Linux Logging
Modern Linux systems, including Arch, typically use two logging systems that work in tandem. It's crucial to understand both.
rsyslog(and similar): The traditional, file-based system. It writes logs as plain text files into the/var/logdirectory. This makes them easy to read and process with standard command-line tools.journald: The newer system introduced bysystemd. It captures logs from all over the system (including kernel, services, etc.) and stores them in a structured, indexed binary format. You interact with it using thejournalctlcommand.
Let's begin by reading a short article that explains how these two systems coexist.
How Linux Logging Systems Work and Store Data
The article 'A Complete Guide to Linux Log File Locations' from Last9 provides a concise introduction to the two main Linux logging mechanisms. This will set the foundation for everything we cover in this lesson.
Please read the introductory section and the part titled 'How Linux Logging Systems Work and Store Data'. Focus on understanding the key differences between rsyslog (text-based) and journald (binary, structured) and the concept of journald forwarding logs to rsyslog.
Now that you have the theoretical overview, let's dive into the practical side, starting with the modern journalctl.
Part 1: The systemd Journal (journalctl)
Since we just covered systemd and systemctl, journalctl is the natural next step. It's an incredibly powerful tool for querying the logs that systemd and its services produce.
journalctl Basics: How to Easily Check Your Linux Logs
The video 'journalctl Basics' by Learn Linux TV is an excellent introduction. It specifically mentions Arch Linux and explains the role of systemd, which should feel familiar.
Watch from the beginning (00:39) to 05:25. This will explain what journalctl is, its connection to systemd, and demonstrate its most basic use, including the real-time follow mode (-f).
Filtering: The Real Power of journalctl
The true strength of journalctl lies in its ability to quickly filter the vast amount of log data. Because the logs are structured, you can slice and dice them in powerful ways.
Filtering by Service (Unit)
This is the most direct link to our previous lesson. If you want to see the logs for a specific service, you use the -u (for "unit") flag.
journalctl Basics: How to Easily Check Your Linux Logs
Let's continue with the 'journalctl Basics' video to see how to filter by service. The presenter uses the SSH daemon (sshd) as an example, which is a service you'll constantly interact with in your ethical hacking journey.
Watch from 05:25 to 12:04. Pay close attention to the syntax journalctl -u sshd and how it can be combined with the follow flag: journalctl -fu sshd. This combination is one of the most useful for live troubleshooting.
Filtering by Time
Often, you only care about logs from a specific time frame, like "since yesterday" or "in the last hour."
journalctl Basics: How to Easily Check Your Linux Logs
The same video also demonstrates time-based filtering, which is very intuitive.
Watch from 11:59 to 15:07. Note the flexible formats you can use, like yesterday or 1 hour ago.
Other Useful Filters
There are many other ways to filter. Here are a few essential ones to know:
journalctl -p <priority>: Filter by message priority. Priorities range fromemerg(0) todebug(7). Using-p errwill show all messages with priority "error" and higher (crit, alert, emerg). This is invaluable for finding problems quickly.journalctl -b: Show messages from the current boot only.journalctl -b -1: Show messages from the previous boot.journalctl -k: Show only kernel messages (similar to thedmesgcommand).

Part 2: Traditional Logs in /var/log
While journalctl is the modern approach, you absolutely must be familiar with the classic text-based logs in the /var/log directory. Many applications log here by default, and these files are your target for analysis on systems that don't use systemd.
Key Files to Know
The /var/log directory contains many files. Here are some of the most important for security and troubleshooting:
| File Location (Debian/Ubuntu/Arch) | File Location (RHEL/CentOS) | Purpose |
|---|---|---|
/var/log/auth.log |
/var/log/secure |
Authentication logs (logins, sudo commands, SSH) |
/var/log/syslog |
/var/log/messages |
General system messages; a catch-all for many events |
/var/log/kern.log |
(in /var/log/messages) |
Kernel-specific messages (hardware, drivers) |
/var/log/boot.log |
/var/log/boot.log |
Messages from the system boot-up process |
/var/log/pacman.log |
/var/log/dnf.log |
Package manager history (installs, removals, updates) |
/var/log/nginx/ |
/var/log/httpd/ |
Application-specific logs (e.g., for a web server) |
Tools for Reading and Searching Text Logs
Since these are plain text files, we can use standard Linux utilities.
less <file>: The best tool for viewing large log files. It lets you scroll up and down and search for text.tail -f <file>: This is the classic way to "follow" a log file in real-time. New entries are printed to your screen as they are written to the file.grep <pattern> <file>: Your primary tool for searching text files. You can search for keywords like "error", "failed", or a specific IP address.
Let's see a practical demonstration.
Linux Crash Course - Understanding Logging
The video 'Linux Crash Course - Understanding Logging' from Learn Linux TV provides a great tour of the /var/log directory and demonstrates the all-important tail -f command.
Watch from 13:36 to 17:44. The presenter shows how to follow the auth.log file in real-time while another login attempt happens. This is a perfect example of how you'd monitor for suspicious activity.
A Note on Log Rotation
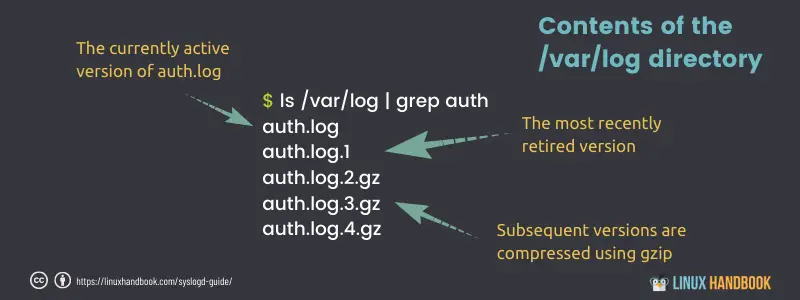
You might notice files in /var/log like auth.log.1, auth.log.2.gz, etc. Log files can't grow forever, or they would fill up the disk. A process called log rotation automatically renames and compresses old logs to save space.
auth.log: The current, active log file.auth.log.1: The most recent "retired" log file.auth.log.2.gz: An older log file that has been compressed withgzip. To read it, you'd need to use a tool likezlessorzgrep.
Hands-on Practice
It's time to put this into practice on your own system. Open your terminal and let's get to work.
-
Investigate a Service with
journalctl
In the last lesson, you may have installednginx. Let's assume it's installed.- Check its status:
systemctl status nginx - Now, view its logs:
journalctl -u nginx - Restart the service (
sudo systemctl restart nginx) and immediately runjournalctl -u nginxagain. You should see the new log entries for the stop and start events.
- Check its status:
-
Live Monitoring with
journalctl
Let's monitor SSH activity. Open two terminals.- Terminal 1:
journalctl -fu sshd - Terminal 2: Try to SSH into your own machine:
ssh your_username@localhost. Enter your password. - Watch the logs appear in Terminal 1. Now, try again but enter the wrong password. Observe the "Failed password" message. This is exactly what you'd look for when hunting for brute-force attacks.
- Terminal 1:
-
Live Monitoring with
tailandgrep
Let's do the same thing, but the classic way.- Terminal 1:
tail -f /var/log/auth.log(You may needsudoto read this file). - Terminal 2: Use a
sudocommand, for example:sudo whoami. - Observe the new entry in Terminal 1 detailing your use of
sudo.
- Terminal 1:
-
Searching for Evidence
Usegrepto search for all failed login attempts on your system.# The -i flag makes the search case-insensitive grep -i "failed password" /var/log/auth.logThis command is fundamental for security audits.
Conclusion
You now have the skills to query the two most important logging systems in Linux. This ability to look "under the hood" is what separates a casual user from a system administrator or security professional.
Key Takeaways:
- Two Systems: Modern Linux uses both the
systemdjournal (journalctl) and traditional text logs (/var/log). journalctl: Best forsystemdservices. Its power is in structured filtering by unit (-u), time (--since), priority (-p), and boot (-b)./var/log: Home of traditional text logs. Essential tools arelessfor viewing,tail -ffor real-time monitoring, andgrepfor searching.- Security Context: Logs are your primary source for detecting unauthorized access, troubleshooting service failures, and understanding system behavior after a potential compromise.
Next Lesson Preview:
After finding an issue in the logs—perhaps a service failing due to a misconfiguration—the next logical step is to fix it. In our next lesson, we will cover how to edit system configuration files using a terminal text editor like vim or nano, giving you the power to act on the information you've discovered.