Hello! Welcome to our next lesson.
In the last session, we focused on user identity and privileges, mastering the su and sudo commands. You learned how to switch between user accounts and execute commands with elevated permissions—a core skill for moving around a Linux system.
Today, we shift our focus from the users to the programs they run. Every command you execute, every application you open, and every background service running on your system exists as a process. Understanding and managing these processes is fundamental to system administration and a crucial step in security analysis. When an attacker gains access to a system, one of the first things they do is list running processes to understand what the system is doing, what services are available to attack, and whether their own malicious tools are running correctly.
Our learning outcome for this lesson is to explain what a PID is and list running processes using ps, top, and htop.
1. What is a Process and a PID?
At its core, a process is simply a program in execution. When you launch a program like Firefox or run a command like ls, the Linux kernel creates a process to manage it. To keep track of all these concurrently running programs, the kernel assigns a unique number to each one, called the Process ID, or PID.
This PID is the primary way the system—and you—can refer to a specific process to monitor it, manage its resources, or terminate it.
A fascinating aspect of Linux, which will appeal to your interest in system internals, is how it represents processes. The kernel exposes a virtual filesystem called /proc. Inside this directory, you'll find a subdirectory for every single running process, named after its PID.
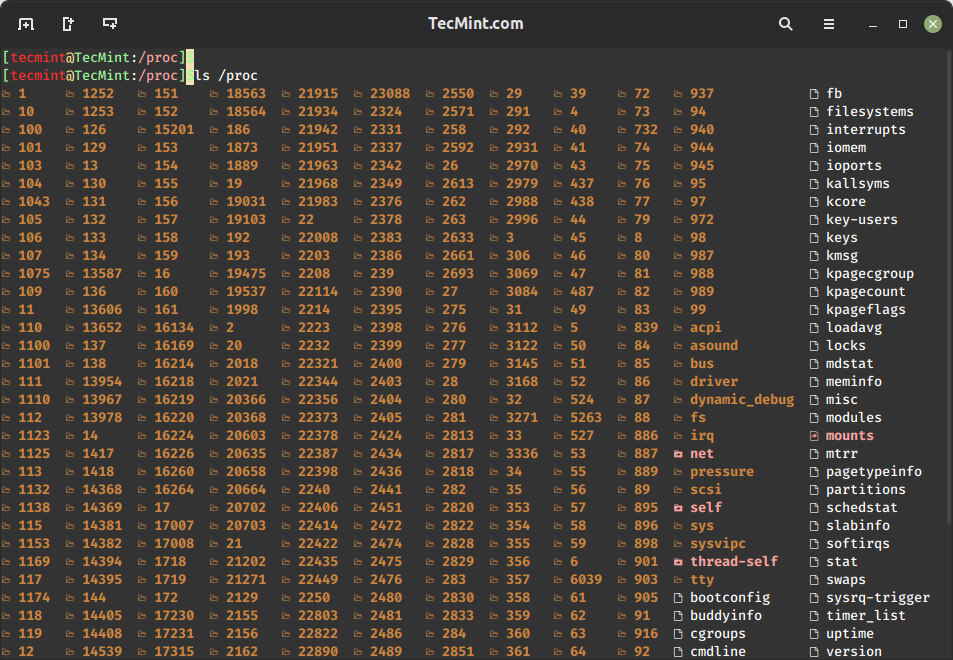
Let's get a more formal definition of a PID and its role.
The article "What is pid in Linux?" from Scaler Topics provides a solid foundation. It clearly defines what a PID is, how it's assigned, and its importance in process management.
Read the introduction, the section "How PIDs are Assigned?", and "PID Usage in Process Management". Pay special attention to the concept of PID 1, which is the ancestor of all other processes.
From the reading, here are the crucial points to remember about PIDs:
- Uniqueness: No two running processes can have the same PID.
- Assignment: PIDs are assigned sequentially by the kernel, starting from 1.
- PID 1: This is a special process. On modern systems like Arch Linux, this is
systemd. It's the first process started at boot and is the ultimate parent of all other processes on the system. If you kill PID 1, you crash the system. - Management: PIDs are used for everything: identifying, monitoring, killing, prioritizing, and signaling processes.
2. The ps Command: A Static Snapshot
The ps (process status) command is your primary tool for taking a static "snapshot" of the processes running at a single moment in time. While it has many options, the most common and powerful combination you'll use is ps aux.
Let's break down this command and its output with a detailed guide.
Complete Guide to Linux Process Management and Monitoring for Absolute Beginners
The "Complete Guide to Linux Process Management" from Owais.io has an excellent section on ps aux. It breaks down the command options and provides a clear table explaining each column in the output.
Read the section titled "Listing All Processes with ps aux". Focus on understanding the meaning of the a, u, and x options, and study the table that explains the output columns like USER, PID, %CPU, and COMMAND.
Hands-On Lab: Using ps
Now, let's put ps to use in your terminal.
-
Run your first
pscommand. This will likely show very little—just the processes running in your current terminal.ps -
Get the full picture. Now use the combination you just learned about. The output will be very long.
ps aux -
Make the output manageable. Since the output is long, it's best to "pipe" it into a pager like
less. This allows you to scroll up and down.ps aux | lessPress
qto exitless. -
Find a specific process. This is a common task in pentesting—checking if a specific service is running. Let's try to find the SSH daemon,
sshd.ps aux | grep sshdLook at the output. You should see at least one line for the
sshdprocess. Identify itsUSER(it should beroot) and itsPID. The second line you see is likely thegrepcommand itself, which is a process too!
3. Real-Time Monitoring with top and htop
While ps is great for a snapshot, you'll often want to see what's happening on a system in real-time. This is where top and htop come in. They provide a live, dynamic view of your running processes.
top: The Classic Monitor
top is a standard utility included in virtually every Linux distribution. It's a fundamental tool for any system administrator or security professional.
Understanding Linux System Performance | The Top Command
This video from Akamai Developer explains why top is still a crucial tool to learn, even with modern alternatives available. It also provides a great walkthrough of the information presented in the top interface.
First, watch from the beginning to 00:49 to understand why top is essential. Then, watch from 14:10 to 15:14 to get a detailed breakdown of the process list columns, including the all-important PID column.
htop: The Enhanced Monitor
htop is an improved, interactive process viewer. It's more user-friendly, provides visual bars for resource usage, and allows for easier sorting and management. It might not be installed by default, but on your Arch system, you can easily install it.
sudo pacman -S htop
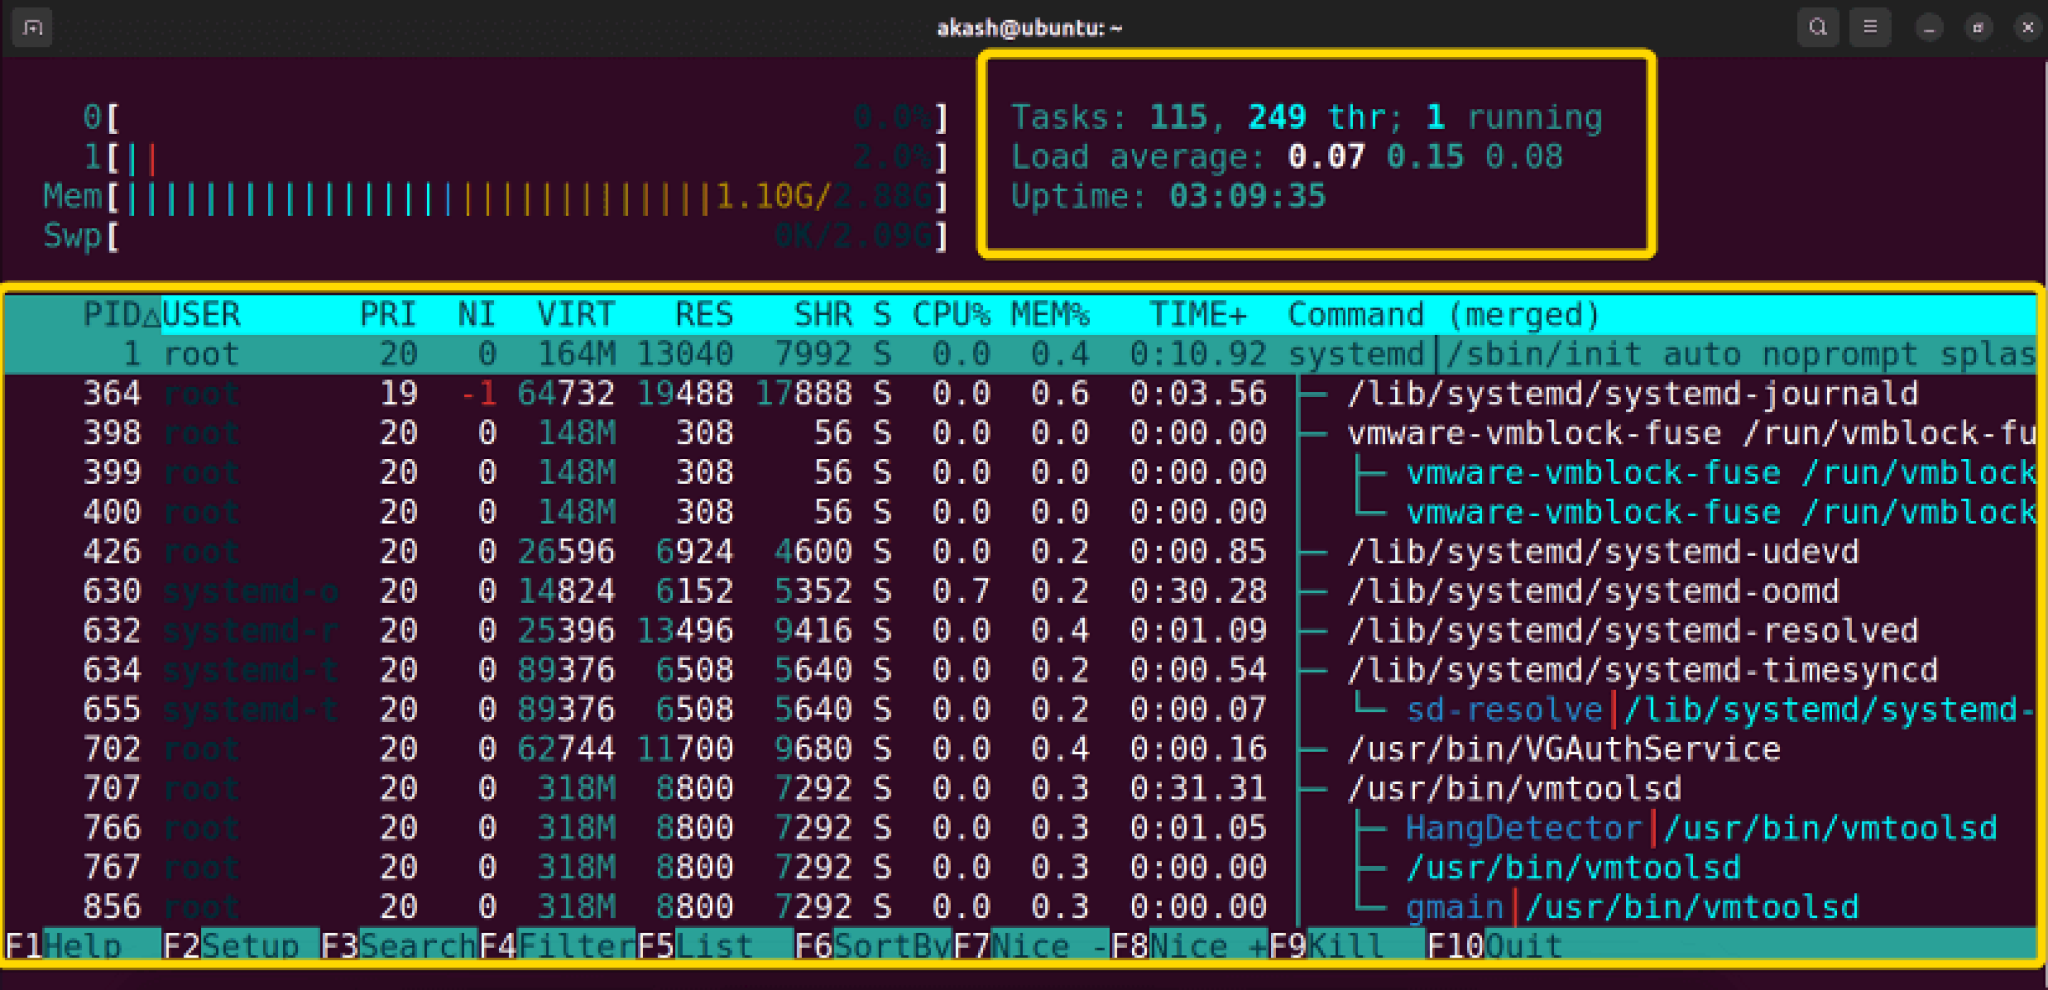
Hands-On Lab: Using top and htop
Let's get a feel for these interactive tools.
-
Launch
top.topWatch the list update automatically. The processes at the top are the ones using the most CPU.
- Press
Shift+M(a capital M) to sort the list by memory usage. - Press
Shift+P(a capital P) to sort back by CPU usage. - Press
qto quit.
- Press
-
Launch
htop.htopYou'll immediately notice the more modern interface.
- Use the Up and Down arrow keys to select different processes.
- Press the F6 key. A menu will appear on the left. Use your arrow keys to select
PERCENT_MEMand press Enter to sort by memory. Try sorting byPIDas well. - Press the F4 key. A filter prompt will appear at the bottom. Type a process name (e.g.,
bash) and press Enter to show only matching processes. PressF4and Enter again to clear the filter. - Press F10 or
qto quit.
Conclusion
You now have the fundamental skills to see and understand what's running on your Linux system. This is a critical building block for both system administration and ethical hacking, as "what's running?" is one of the first questions you'll ask on any new target.
Key Takeaways:
- A process is a running instance of a program, and the PID is its unique numeric identifier.
- The
ps auxcommand gives you a comprehensive static snapshot of all running processes. topis the classic tool for real-time process monitoring, available on almost any system.htopis a modern, user-friendly alternative totopthat provides an enhanced, interactive experience.- In all these tools, the PID is the key piece of information that uniquely identifies a process for further action.
Next Lesson Preview:
You can now list processes and identify their PIDs. But what can you do with that information? In our next lesson, we will cover how to control processes by sending them signals. You'll learn how to use the kill and killall commands to gracefully stop or forcefully terminate misbehaving or unwanted processes—a power you'll use constantly.