Hello! In our last lesson, we explored how quartiles divide a dataset into four equal segments, giving us a more structured view than a single measure of central tendency. We're now going to generalize that powerful idea.
This lesson expands our toolkit of positional measures by introducing deciles and percentiles. Instead of splitting our data into four parts, we'll learn to divide it into ten (deciles) or one hundred (percentiles) equal parts. This allows for a much finer-grained analysis of where a specific data point stands relative to the entire dataset. By the end of this lesson, you will be able to calculate and, just as importantly, interpret these measures.
From Quarters to Hundredths: Defining Deciles and Percentiles
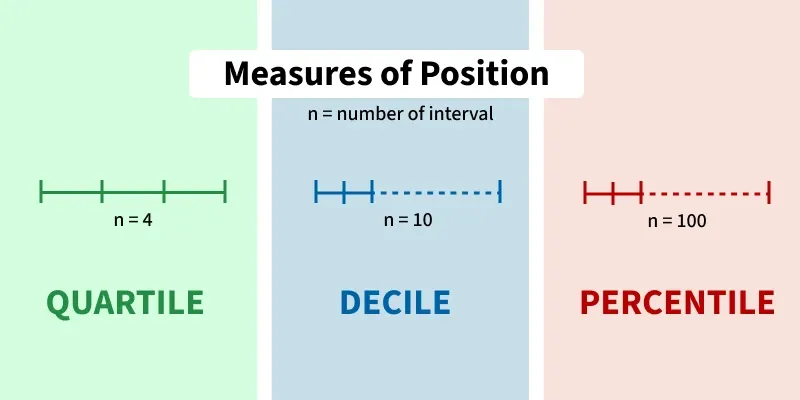
Quartiles, deciles, and percentiles all belong to a family of positional measures called quantiles. They are simply different ways of carving up an ordered dataset.
- Quartiles divide the data into 4 equal parts.
- Deciles divide the data into 10 equal parts. The first decile (D1) is the point below which 10% of the data lies, the second (D2) marks the 20% point, and so on up to D9.
- Percentiles divide the data into 100 equal parts. The first percentile (P1) is the point below which 1% of the data lies, up to P99.
You can see that these concepts are directly related. For instance, the first quartile (Q1) is the same as the 25th percentile (P25). The median (Q2) is the same as the fifth decile (D5) and the 50th percentile (P50).
The video below gives an excellent overview of how these three measures relate to each other.
Quartiles, Deciles, & Percentiles With Cumulative Relative Frequency - Data & Statistics
This initial segment from The Organic Chemistry Tutor clearly illustrates the hierarchy and relationship between quartiles, deciles, and percentiles.
Watch from the beginning until the visual explanation. Pay attention to how the number line is partitioned and how specific points like Q2, D5, and P50 all align at the median.
The Interpretive Power of Percentiles
The real value of percentiles lies in their ability to contextualize a single data point. Knowing you scored 1340 on the SAT is less informative than knowing this score places you in the 90th percentile, meaning you scored higher than 90% of test-takers. This provides a clear relative standing.
Let's watch a brief clip that solidifies this idea.
Quartiles, Deciles, & Percentiles With Cumulative Relative Frequency - Data & Statistics
This part of the video uses the familiar example of an SAT score to explain the practical meaning of a percentile.
Watch the section from the SAT example. The key takeaway is how a percentile rank communicates performance relative to a peer group.
Calculating Percentiles and Deciles
Just as with quartiles, there is no single, universally mandated formula for calculating percentiles. Different statistical software packages (like Python's pandas or Excel) use slightly different methods, which can produce minor variations in results, especially for small datasets.
A very common and robust method, often used in software, is linear interpolation. This will likely feel intuitive given your computer science background, as it provides a precise, algorithmic way to handle cases where a percentile falls between two data points.
The general process is:
- Order the data from smallest to largest.
- Calculate the position (or locator) of the percentile using a formula. A common one is , where is the number of data points and is the desired percentile.
- Find the value:
- If is a whole number, the percentile is the value at that position.
- If is a decimal, you interpolate between the two data points surrounding that position.
The following video provides a very clear, step-by-step demonstration of this interpolation method.
Percentiles - How to calculate Percentiles, Quartiles, ...
This video by Joshua Emmanuel walks through calculating percentiles for a small dataset, clearly explaining how to handle both integer and decimal locator values.
First, watch how the locator formula is defined and used for the 46th percentile, where the result is a decimal requiring interpolation: Calculation of P46. Next, see the simpler case where the locator is a whole number for the 75th percentile (Q3): Calculation of Q3. Finally, watch one more interpolation example for the 9th decile (90th percentile): Calculation of D9.
The method you just saw is an excellent, general-purpose approach. To deepen your understanding of why different methods exist and how they relate, the following article provides a good overview.
Percentiles: Interpretations and Calculations
This article by Jim Frost explores the nuances of percentile calculations, which helps explain the minor discrepancies you might see between different tools.
Focus on the section "Calculating Percentiles". Read through the descriptions of "Definition 1," "Definition 2," and especially "Definition 3: Using an Interpolation Approach". This will solidify the logic behind the method shown in the video and highlights its advantage in being more precise than simpler rounding methods.
A Practical Walkthrough with Formulas
The GeeksforGeeks article below provides numerous clear examples using a slightly simpler locator formula, , where the result is typically rounded to the nearest integer rank. While interpolation is more precise, this rank-based method is very common for manual calculations and easy to follow.
Partition Value | Quartiles, Deciles and Percentiles
This resource provides straightforward formulas and examples for calculating deciles and percentiles.
First, review the section on Deciles. Pay attention to the formula Dk and work through "Example 1" to see it in action. Next, read the section on Percentiles. Note the similar formula for Pk and follow "Example 1" to see how the 20th and 90th percentiles are found for a small dataset.
Visualizing Positional Measures on a Distribution
Calculating these values is one thing; seeing how they relate to the shape of your data is another. When you have a distribution of data, like in a histogram, percentiles mark specific points along the x-axis.

Let's Work an Example
Let's tie this all together with the interpolation method.
Consider the following ordered dataset of 11 exam scores:61, 65, 68, 75, 79, 82, 85, 89, 93, 95, 99
Let's find the 80th percentile (P80).
- Data: We have ordered data points.
- Locator: .
- Interpret Locator: The locator 9.6 tells us P80 is between the 9th and 10th data points. Specifically, it's 60% of the way from the 9th value to the 10th.
- Values: The 9th value is 93, and the 10th value is 95.
- Interpolate:
Interpretation: A score of 94.2 is at the 80th percentile. This means 80% of the scores are below 94.2, and 20% are above it.
Conclusion
In this lesson, we have extended the concept of quartiles to the more general and finer-grained measures of deciles and percentiles. These are essential tools for understanding the relative position of any given value within a dataset.
Key Takeaways:
- Deciles and Percentiles partition ordered data into 10 and 100 equal parts, respectively. They are types of quantiles.
- Their primary use is to determine the relative standing of a data point (e.g., "this value is in the 90th percentile").
- Calculation typically involves a locator formula to find the position in the ordered data.
- When the locator falls between two points, linear interpolation is a precise method to find the percentile value, and it's an approach commonly used in statistical software.
We now have a solid understanding of Q1, Q2 (the median), and Q3. In our next lesson, we will use these values to calculate the interquartile range (IQR), a robust measure of statistical dispersion that is fundamental to identifying outliers and constructing boxplots.