Welcome back! In our first lesson, we established that statistics is the science of learning from data to make evidence-based decisions. We saw that it forms the theoretical backbone for data science and machine learning. Now, we'll build on that foundation by exploring the two primary branches of statistical analysis.
Today's lesson addresses a fundamental distinction in statistics: the difference between describing data you have and using that data to make predictions about a larger group. You will learn to differentiate between descriptive statistics and inferential statistics. Understanding this division is crucial because it defines the two main ways we approach data analysis and structures much of the statistical methodology you will learn throughout this course.
The Core Idea: Population vs. Sample
Before we can properly define the two branches of statistics, we must first understand the two fundamental concepts they operate on: the population and the sample. The distinction between these two is the very reason we need two different types of statistics.
Let's watch a short, clear explanation that uses a memorable analogy to introduce these terms.
Quantitative Data Analysis 101 Tutorial: Descriptive vs Inferential Statistics (With Examples)
The video "Quantitative Data Analysis 101 Tutorial" provides an excellent introduction to these concepts before diving into the main topic.
Watch the segment from this brief detour that explains the lingo of "population" and "sample." The chocolate cake analogy is particularly effective.
As the video explains:
- A Population is the entire group that you want to draw conclusions about. This could be "all Tesla owners in the US," "all emails sent from a server," or "every potential user of a new software application."
- A Sample is a specific subgroup of individuals that you will actually collect data from. It is a smaller, manageable piece of the population.
The relationship between these concepts, and how the two types of statistics fit in, is visualized perfectly in the following diagram.

This flow—from population to sample and back to population—is the essence of data analysis. Now, let's look at the specific roles descriptive and inferential statistics play in this process.
Descriptive Statistics: Describing the Data in Hand
As its name suggests, descriptive statistics is used to describe or summarize the characteristics of a dataset. When you calculate the average score for a class, find the most common car color in a parking lot, or graph the monthly sales figures for the past year, you are using descriptive statistics.
The key thing to remember is that descriptive statistics do not go beyond the data you have. They provide a straightforward summary of your sample.
Quantitative Data Analysis 101 Tutorial: Descriptive vs Inferential Statistics (With Examples)
Let's return to the "Quantitative Data Analysis 101" video for its clear explanation of descriptive statistics.
Watch the segment from this overview, which defines the role of descriptive statistics and lists some of the most common measures, like mean, median, mode, standard deviation, and skewness. We will study each of these measures in detail in later lessons.
To get a more formal list of what descriptive statistics covers, let's turn to a textual resource.
Descriptive vs. Inferential Statistics: What's the Difference?
The article "Descriptive vs. Inferential Statistics" from Coursera provides a great breakdown.
Please read the section under the heading What are descriptive statistics?, focusing on the main types of measures it looks at: central tendency, variability, and shape/distribution.
In short, descriptive statistics helps you get a feel for your data by painting a clear picture of its main features.
Inferential Statistics: Making the Leap
This is where the real power of statistics comes into play. Inferential statistics uses the data from your sample to make inferences, or educated guesses, about the larger population.
Because it's often impractical or impossible to collect data from an entire population (imagine trying to poll every voter in a country), we rely on a sample. Inferential statistics provides the tools to generalize from that sample to the population, but it does so with an understanding of uncertainty.
A great way to grasp this is with a simple, practical example.
Descriptive Statistics vs Inferential Statistics
The video "Descriptive Statistics vs Inferential Statistics" by The Organic Chemistry Tutor has a very intuitive example about car preferences in a city.
Watch from the beginning of the inferential statistics section. Notice how he moves from a fact about the sample (20 out of 100 people like blue cars) to an inference about the population (we can say 20% of the whole city, plus or minus some error, likes blue cars).
This "plus or minus some error" is a critical concept. Because your sample is not the entire population, your inference will always have some degree of uncertainty. This is known as sampling error.
Inferential Statistics | An Easy Introduction & Examples
The Scribbr article "Inferential Statistics | An Easy Introduction & Examples" explains this source of uncertainty very clearly.
Find the heading "Descriptive versus inferential statistics." Read the two subsections on descriptive and inferential statistics, then focus on the part titled Sampling error. This explains why uncertainty is a built-in part of making inferences.
Your computer science background equips you to work with deterministic systems where the same input yields the same output. Statistics, particularly inferential statistics, provides the framework for reasoning in non-deterministic systems where randomness and variability are inherent. We use probability to quantify our confidence in our conclusions despite this uncertainty.
Just as with descriptive statistics, there is a set of common tools used for inference.
Descriptive vs. Inferential Statistics: What's the Difference?
Let's return to the Coursera article.
Now, read the section under the heading What is inferential statistics?. This section lists the common tools used to make inferences, such as hypothesis testing, regression, and confidence intervals. Don't worry about understanding every term right now; we will dedicate entire lessons to them later.
A Side-by-Side Comparison
To solidify your understanding, let's look at a direct comparison and a final example.
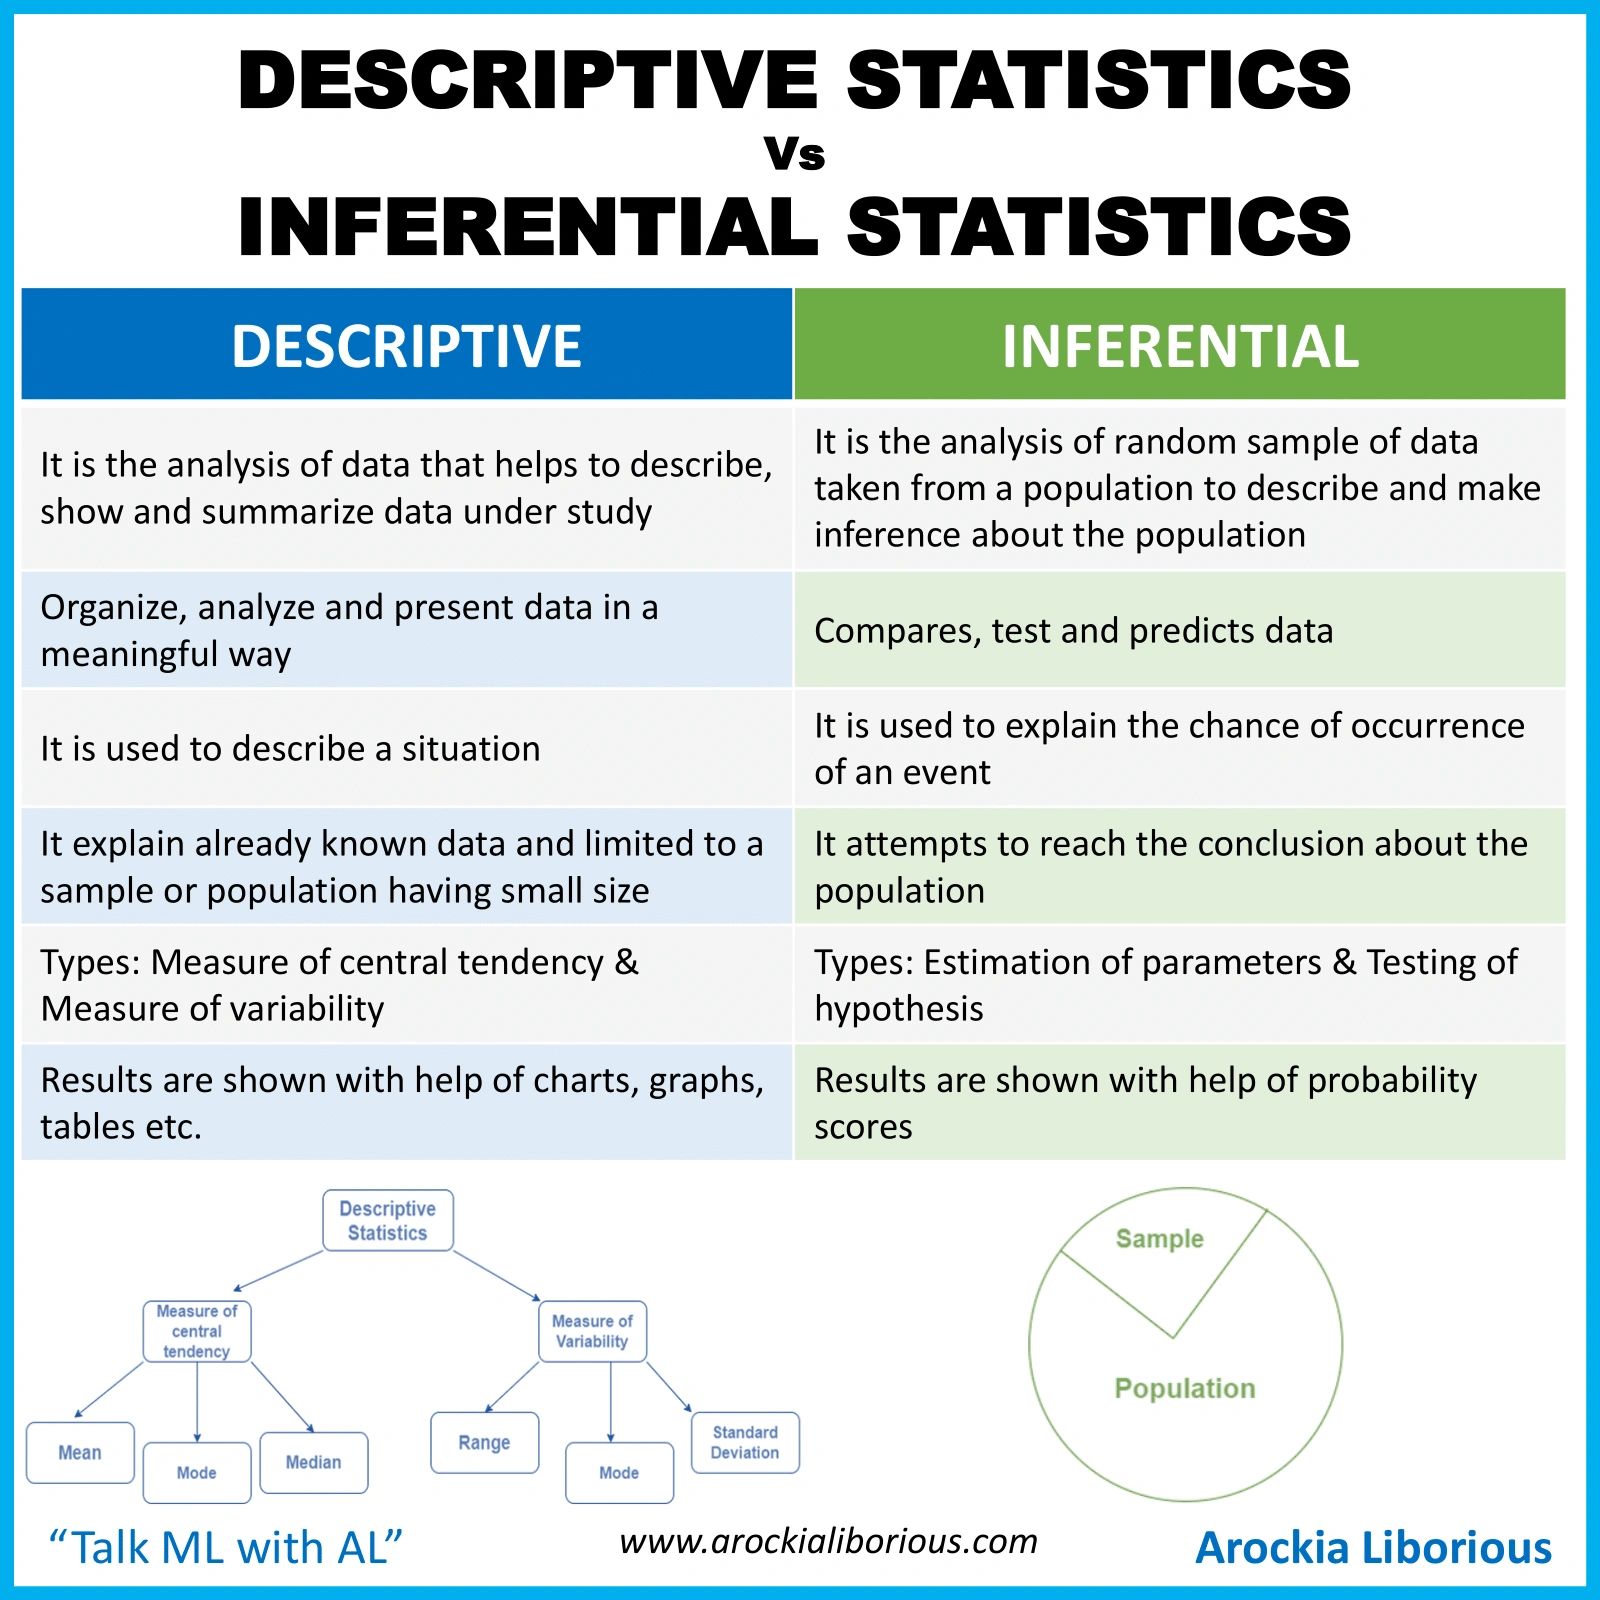
Finally, let's see how both types of statistics can be applied in a single scenario.
Descriptive vs. Inferential Statistics: What's the Difference?
The Coursera article provides a helpful example from a healthcare setting.
Read the short section titled Descriptive statistics vs. inferential statistics examples. Pay attention to how it clearly separates the descriptive statements (average BMI, percent of diabetics) from the inferential goals (predicting likelihood of diabetes, measuring correlation).
Conclusion
In this lesson, we have dissected statistics into its two main branches. You now have a conceptual framework for organizing all the statistical techniques you will learn going forward.
Here are the key takeaways:
- Foundation: The difference between the two hinges on the concept of population (the whole group) versus sample (the part you measure).
- Descriptive Statistics: Its purpose is to summarize and describe the sample data. It deals with facts about the data you have collected, often presented as numbers (mean, median) or graphs.
- Inferential Statistics: Its purpose is to use the sample data to make inferences or predictions about the population. It allows you to generalize your findings but always involves a degree of uncertainty due to sampling error.
- Relationship: They are not mutually exclusive; they are two stages of a single process. You must first use descriptive statistics to understand your sample before you can use inferential statistics to make claims about the population.
This lesson introduced the concepts of population and sampling as the basis for the two types of statistics. In our next lesson, we will explore Population & Sampling in more detail, defining them more formally and explaining precisely why sampling is such a necessary and fundamental part of the statistical process.