Welcome to our third lesson. In our previous discussion, we introduced the fundamental division between descriptive and inferential statistics. We saw that this division hinges on whether we are simply describing data we have or using that data to make predictions about a larger group. The concepts of "population" and "sample" were central to that distinction.
Today, we will delve deeper into these crucial concepts. This lesson is designed to formalize your understanding of what constitutes a population versus a sample and, most importantly, explore the practical and theoretical rationale for using sampling. For anyone aiming to work in data science or machine learning, grasping why and how we work with subsets of data is not just foundational; it is a daily reality.
Defining Population and Sample
In statistics, these terms have precise meanings. A population is the complete set of all items or individuals that you are interested in studying. A sample is a smaller, manageable subset of that population. The entire process of inferential statistics, which we discussed previously, is built upon the idea of studying a sample to learn about the population it came from.
The following image provides a clear, high-level illustration of this relationship.
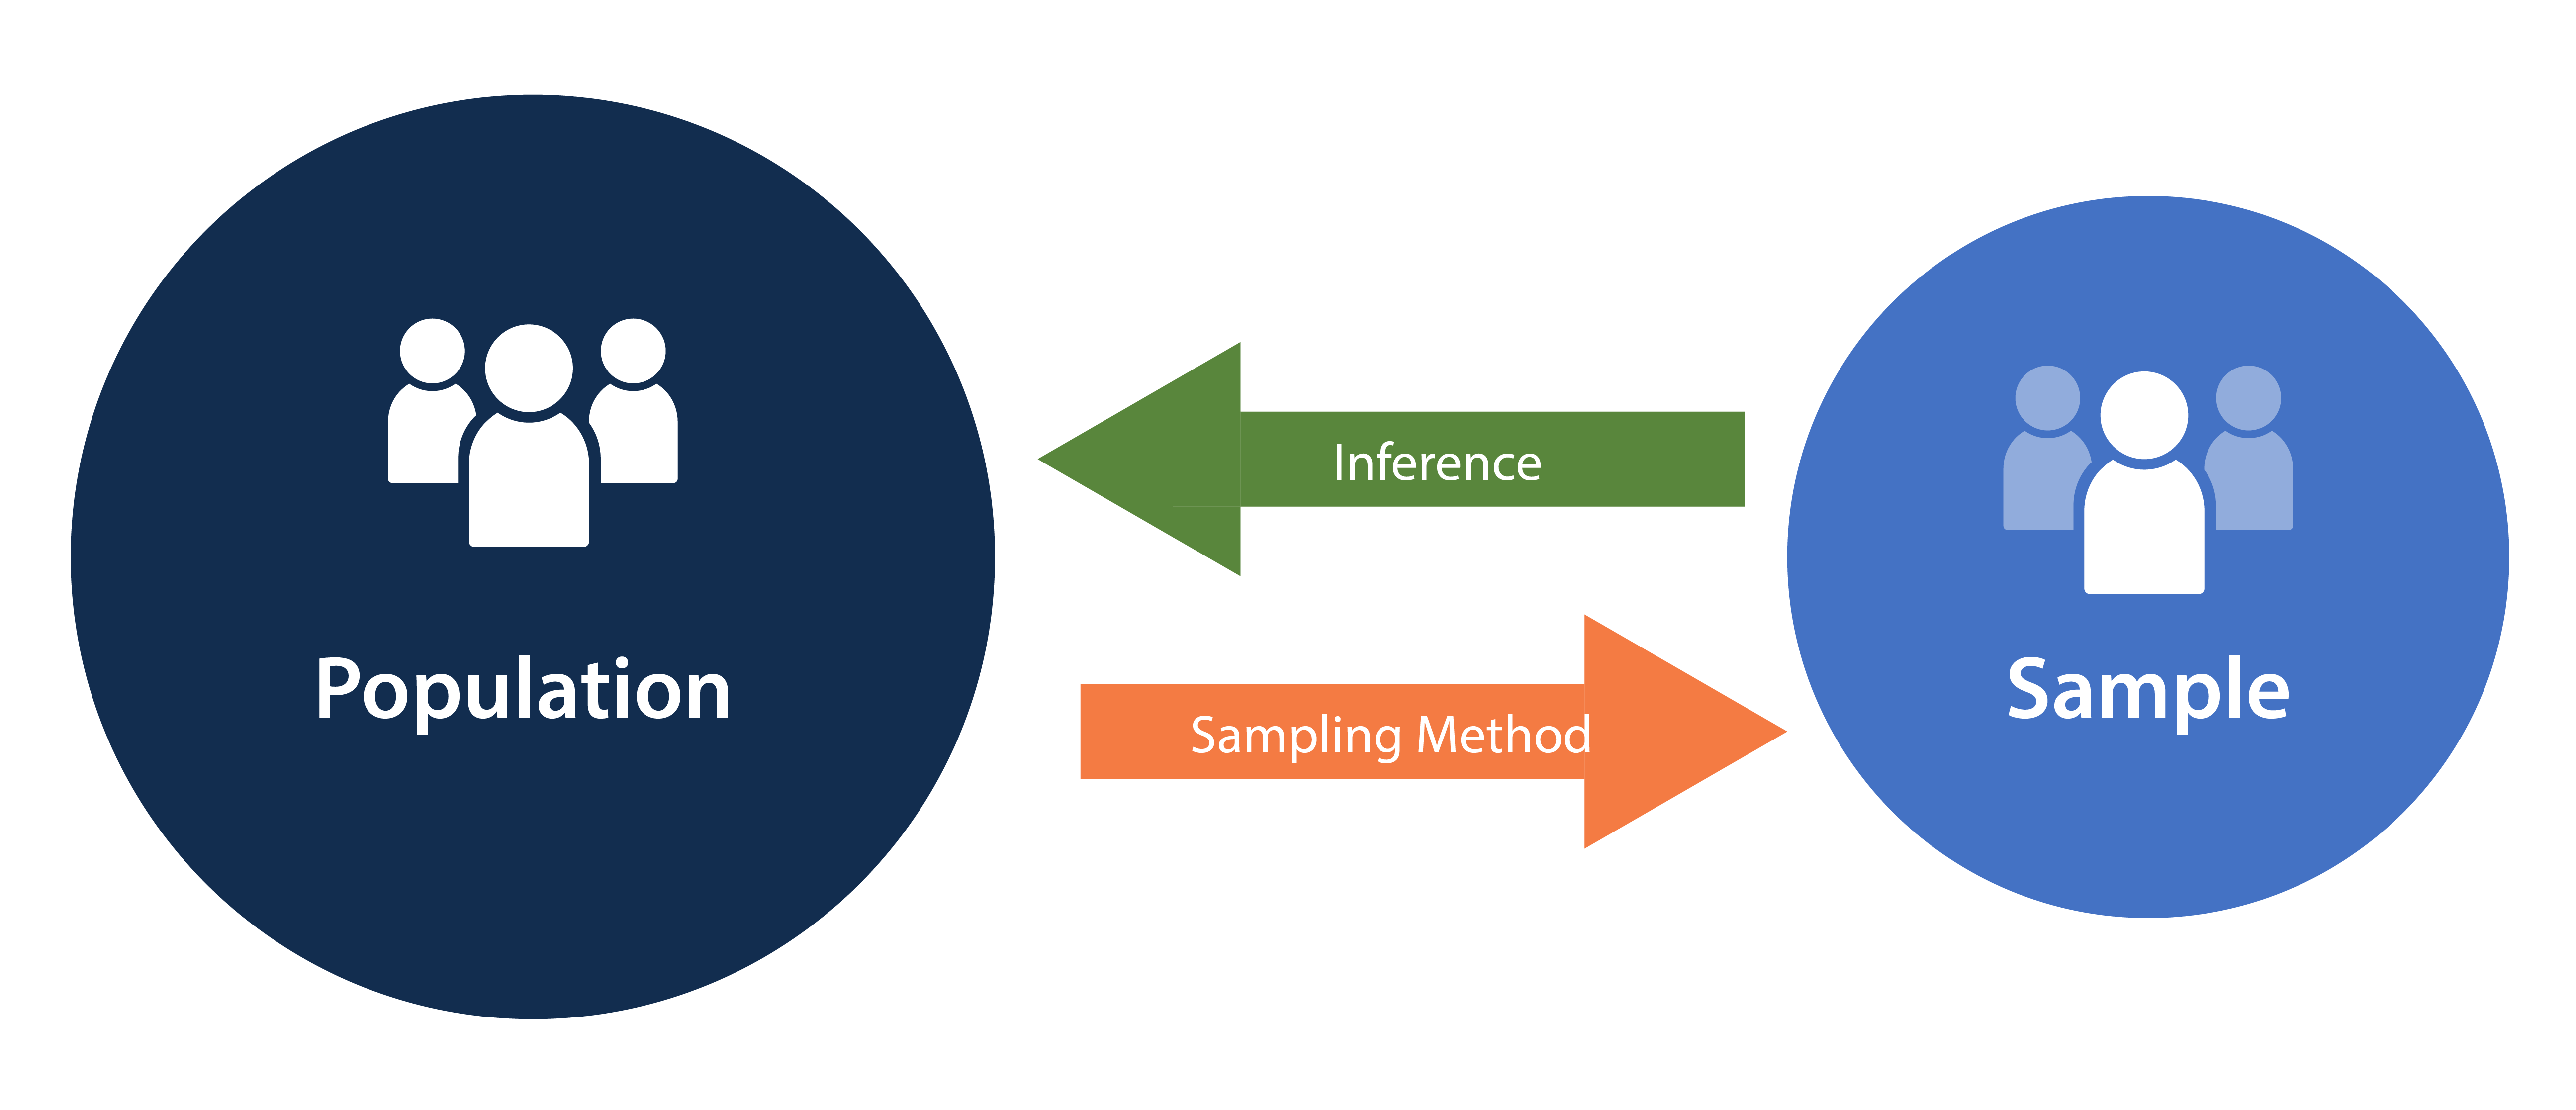
To establish a solid foundation, let's start with a formal definition and some diverse examples.
Population vs. Sample | Definitions, Differences & Examples
The article from Scribbr provides concise definitions and a helpful table of examples.
Please read the introductory paragraphs and the table under the heading Population vs sample. Note how a population isn't always people; it can be any collection of items you want to study, such as songs, job advertisements, or, in a computer science context, network packets or user log files.
As you can see, the population is defined by the scope of your research question. If you are training a machine learning model to classify images of cats and dogs, your theoretical population is "all possible images of cats and dogs," a practically infinite set. The dataset you use for training is your sample.
Parameters vs. Statistics
A critical distinction follows from the population vs. sample split. When we calculate a value, such as an average or a percentage, its name changes depending on whether it was derived from a population or a sample.
- A parameter is a value that describes a characteristic of an entire population. For example, the true average height of all adult men in a country. Population parameters are often represented by Greek letters (e.g., for population mean, for population standard deviation).
- A statistic is a value that describes a characteristic of a sample. For example, the average height of 500 men selected from that country. Sample statistics are usually represented by Latin letters (e.g., for sample mean, for sample standard deviation).
In most real-world scenarios, we cannot know the true population parameter. Instead, we calculate a sample statistic and use it to estimate the unknown population parameter.
Let's watch a short video that clarifies this with some simple examples.
Statistic vs Parameter & Population vs Sample
The video "Statistic vs Parameter & Population vs Sample" by The Organic Chemistry Tutor excels at breaking down these definitions.
Watch the first part of the video, from the beginning up to the main example about the town residents. Then, test your understanding by watching the brief quiz at the end. This will help solidify the difference between a parameter (describing a population) and a statistic (describing a sample).
The Rationale for Sampling
Now we arrive at the core question: if we want to know about the population, why don't we just study the whole population? The process of collecting data from an entire population is called a census. While a census provides a complete picture, it is often not feasible. The vast majority of data analysis relies on sampling for several compelling reasons.
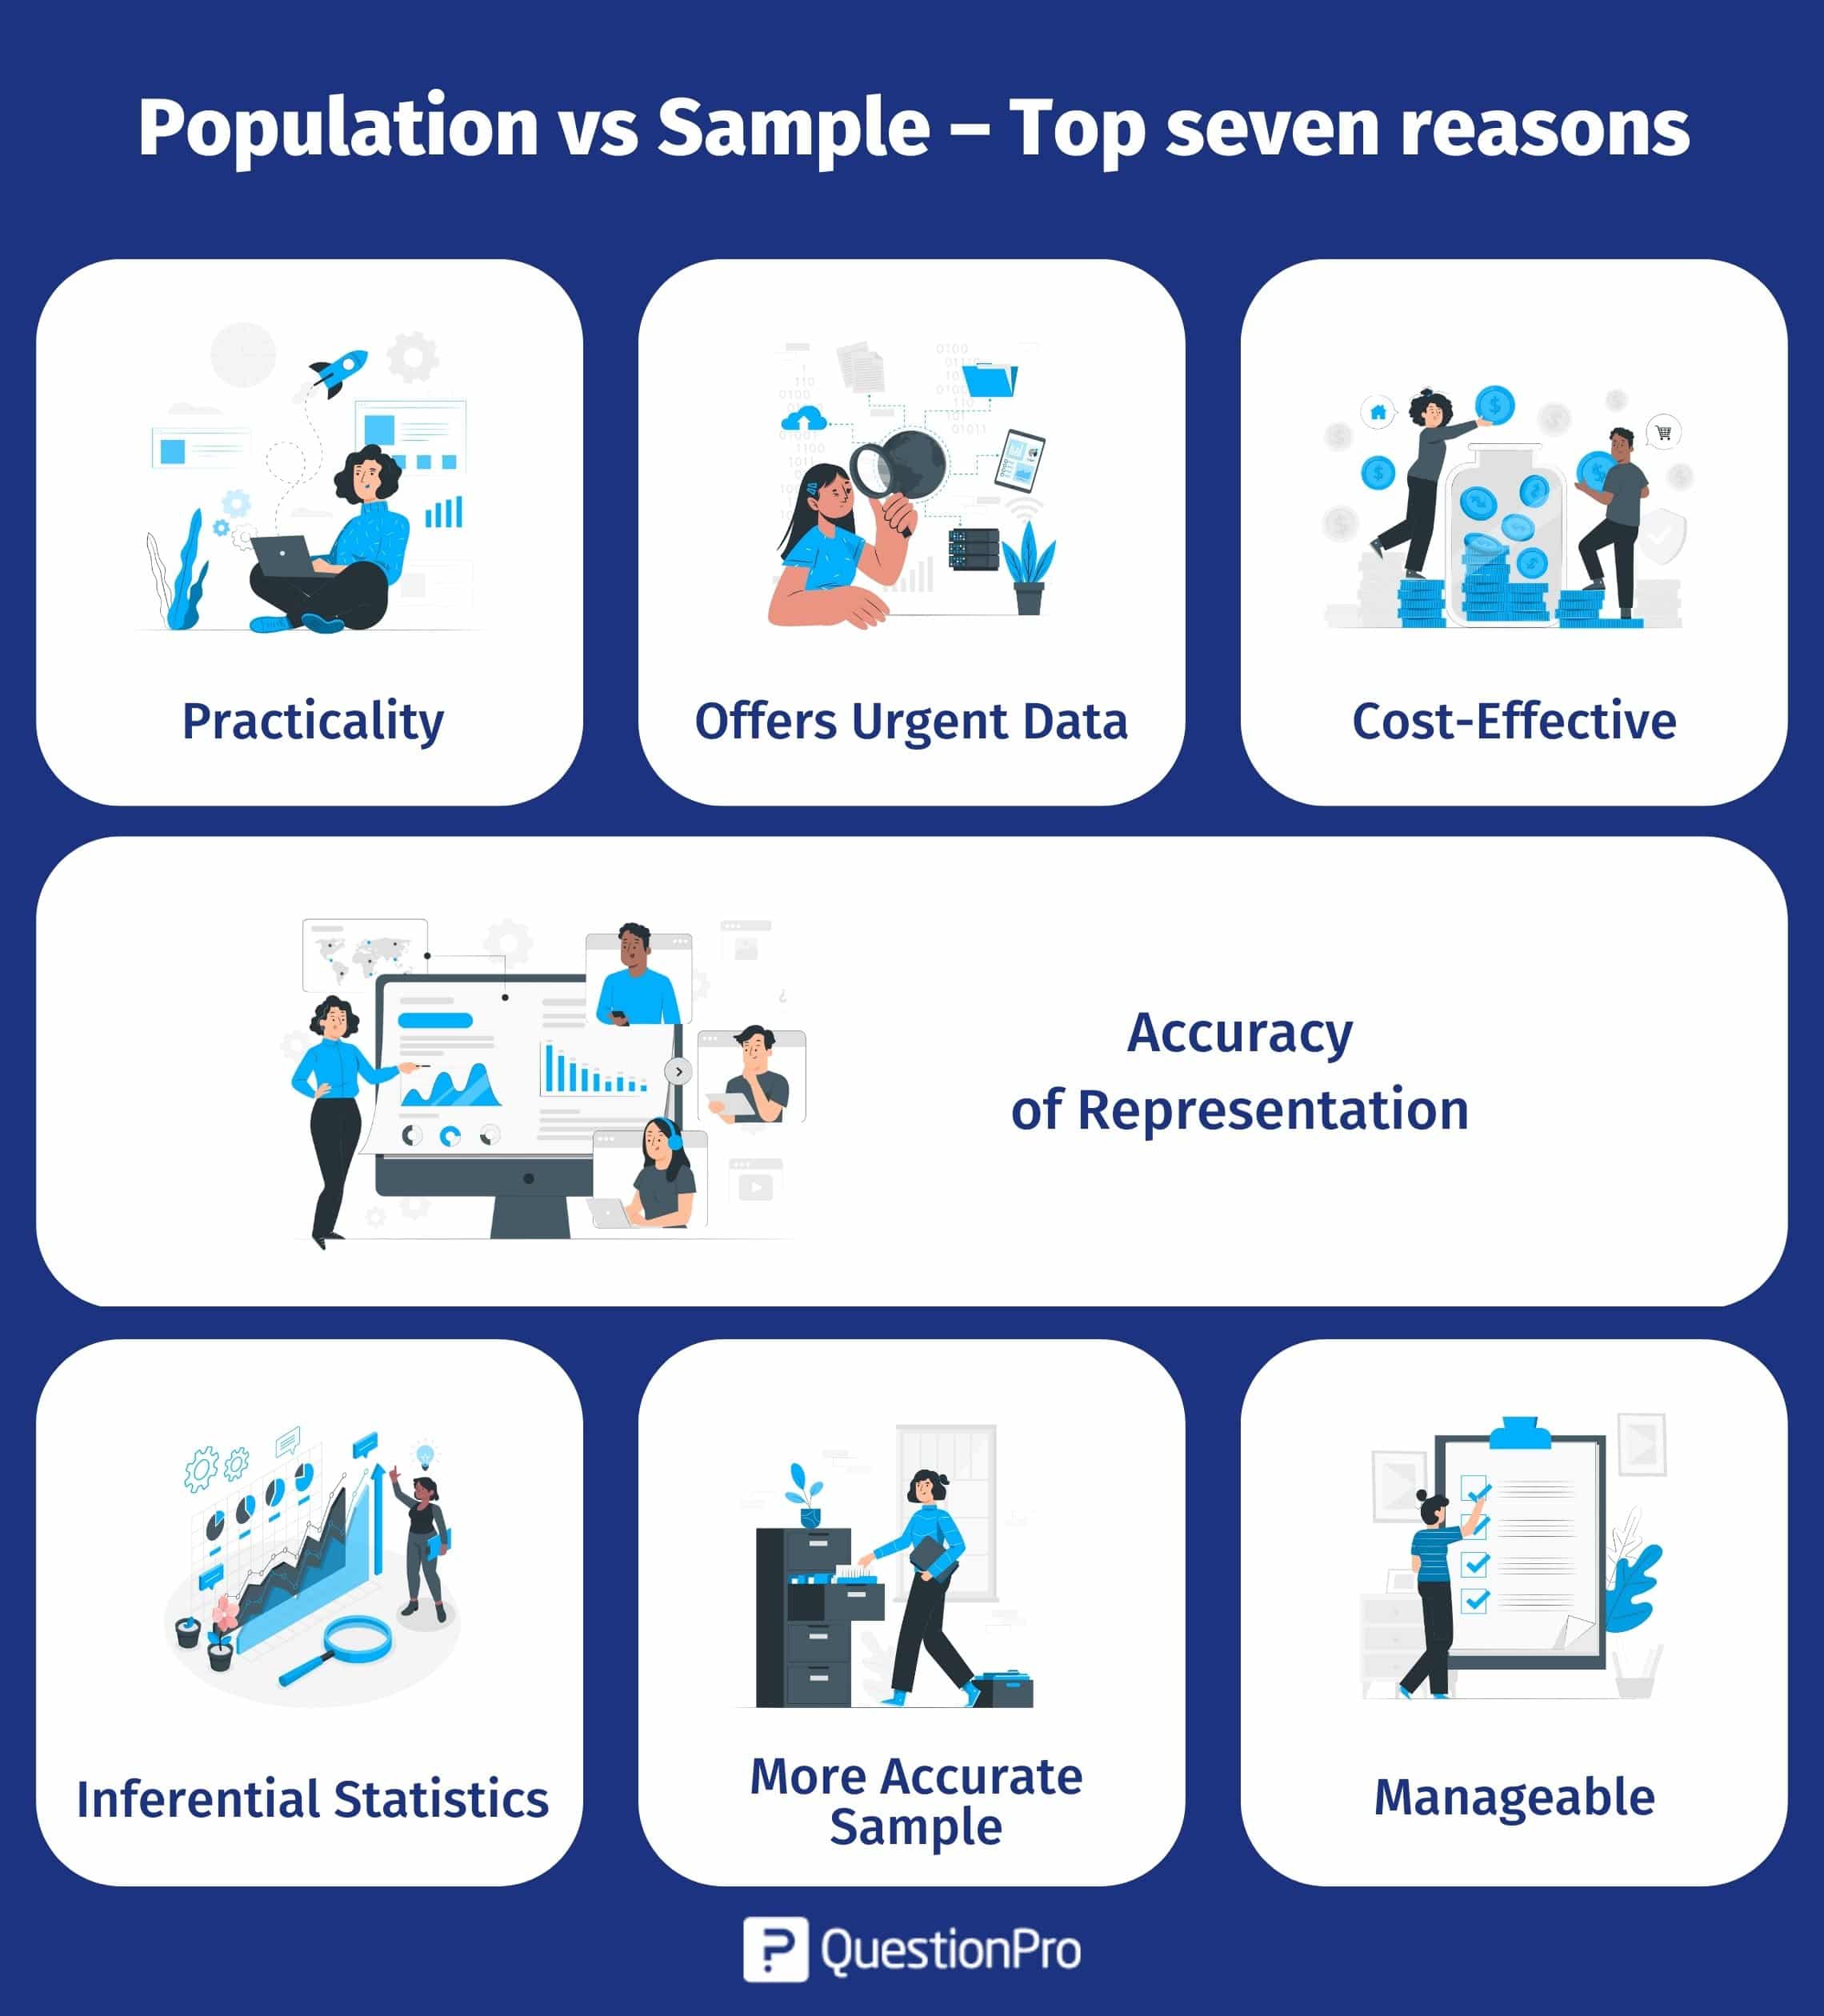
Let's read a detailed explanation of these reasons.
Population vs. Sample | Definitions, Differences & Examples
Let's return to the Scribbr article, which provides an excellent breakdown of the reasons for sampling.
Please find the section titled "Reasons for sampling" and read the four points listed: Necessity, Practicality, Cost-effectiveness, and Manageability.
To summarize the key drivers behind sampling:
- Necessity and Practicality: Sometimes, the population is so large (e.g., all users of Google) or inaccessible (e.g., a species of deep-sea fish) that it's simply impossible to gather data from every member.
- Cost-Effectiveness: A census is expensive. It requires significant time, money, and personnel. Sampling drastically reduces these costs.
- Manageability: From a computational standpoint, which is highly relevant to your background, working with smaller datasets is much more efficient. Storing, processing, and running algorithms on a well-chosen sample is faster and requires less computing power than attempting the same on a massive population dataset (if it even fits in memory).
The 365 Data Science channel provides a very quick summary of this trade-off.
This short clip from the video "Population vs Sample" gets straight to the point.
Watch the segment from this explanation on why we prefer samples. It succinctly states that time and resources are the primary drivers.
The Importance in Computer Science and Machine Learning
These concepts might seem abstract, but they are directly applicable to the work of a computer scientist or machine learning engineer. You rarely, if ever, work with a "population" in the statistical sense. You almost always work with samples.
Population vs Sample in Statistics
The article from GeeksforGeeks has a section dedicated to the relevance of these concepts in computer science.
Please read the section titled Importance in CS. Pay close attention to the examples provided for Data Analysis & Machine Learning, Performance Evaluation, and Big Data.
Think about it:
- When you train a spam filter, you don't use every email ever sent (the population). You use a labeled dataset (a sample) to train the model. The goal is for the model to generalize well to the population of all future emails.
- When you're A/B testing a new feature on a website, you don't show it to all users at once. You roll it out to a sample of users and use their behavior (a sample statistic, like click-through rate) to infer how the entire user base (the population) would react.
- When working with "big data," the data itself is often so vast that you must use sampling techniques just to perform exploratory analysis or build models in a reasonable amount of time.
Conclusion
In this lesson, we have formalized the definitions of population and sample and explored the fundamental reasons why sampling is a cornerstone of modern data analysis.
Here are the key takeaways:
- A Population is the entire group of interest, while a Sample is a subset of that group.
- We use a sample statistic (e.g., sample mean ) to estimate an unknown population parameter (e.g., population mean ).
- The primary reasons for using sampling are necessity, practicality, cost-effectiveness, and manageability. For large-scale data, it is often the only feasible approach.
- These concepts are not just theoretical; they are integral to applied fields like machine learning, software testing, and big data analysis.
We have established that we typically work with data from samples. The next logical question is, what does this data look like? In our next lesson, we will move on to Data & Classification, where we will learn to categorize data by type (e.g., qualitative vs. quantitative) and measurement scale, which is the first step in any data analysis workflow.