Welcome to our fourth lesson in the Foundations of Statistics module. In our last session, we established the crucial distinction between a population and a sample, concluding that for practical reasons, we almost always work with samples of data. This naturally leads to the next question: what is the nature of this data we've collected?
Today, we will answer that question by learning how to classify data. This is a fundamental skill in statistics and data science. We'll start with the broadest classification—qualitative versus quantitative data—and then dive into a more refined framework known as the four scales of measurement: nominal, ordinal, interval, and ratio. Understanding these classifications is not just an academic exercise; it dictates the types of statistical analyses, visualizations, and machine learning models you can apply.
The First Distinction: Qualitative vs. Quantitative Data
At the highest level, all data can be divided into two fundamental types. Grasping this distinction is the first step in any data analysis workflow.
- Qualitative Data (also known as Categorical Data) describes characteristics or qualities. It's non-numerical and deals with labels. Think of it as data that categorizes or describes attributes.
- Quantitative Data (also known as Numerical Data) represents amounts or counts. It's data that can be measured or counted and is expressed in numbers.
Let's begin by reading a short article that defines these two types with clear examples.
Types of Data and the Scales of Measurement | UNSW Online
This article from UNSW provides concise definitions for the two primary data types.
Please read the first three paragraphs, under the heading Data at the highest level: Qualitative and quantitative. Focus on the core definition of each type and the bookshelf example that illustrates the difference.
An important point, especially from a computer science perspective, is that we often assign numbers to qualitative data for processing (e.g., 1 for "male", 2 for "female"). This does not make the data quantitative. The numbers are just labels; you can't perform meaningful mathematical operations on them (e.g., calculating the average gender makes no sense).
The Four Scales of Measurement: Nominal, Ordinal, Interval, and Ratio (NOIR)
While the qualitative/quantitative split is a good start, we need a more detailed system for a deeper analysis. In the 1940s, psychologist Stanley Stevens developed a theory of four scales (or levels) of measurement that has become a cornerstone of statistics. These scales are hierarchical, meaning that each successive scale builds upon the properties of the one before it. The four scales are Nominal, Ordinal, Interval, and Ratio—often remembered by the acronym NOIR.
The following video provides an excellent and clear walkthrough of all four levels, explaining their properties and providing plenty of examples.
Nominal, Ordinal, Interval & Ratio Data: Simple Explanation With Examples
The video "Nominal, Ordinal, Interval & Ratio Data" from Grad Coach explains each level of measurement in a simple, structured way.
Please watch the video from this segment. As you watch, focus on the following for each of the four scales (Nominal, Ordinal, Interval, Ratio): Is it categorical or numerical? What is its key defining characteristic? (e.g., presence of order, equal spacing, a true zero) What are the main examples given?
Understanding the Properties that Define the Scales
As you saw in the video, the scales are built upon a set of properties. Making these properties explicit helps to understand the "why" behind the classification. The four key properties are:
- Identity: Each value is unique and serves as a label. (e.g., "Blue" is not "Red").
- Magnitude (Order): The values have an ordered relationship. (e.g., "Medium" is greater than "Small").
- Equal Intervals: The difference between any two adjacent points on the scale is the same. (e.g., the difference between 10°C and 20°C is the same as between 20°C and 30°C).
- True (or Absolute) Zero: The scale has a zero point that indicates a complete absence of the thing being measured. (e.g., zero kilograms means no weight).
Let's quickly read the formal definitions of these properties.
Types of Data and the Scales of Measurement | UNSW Online
Returning to the UNSW article, this section explicitly defines the properties that differentiate the scales of measurement.
Find the heading "Properties and scales of measurement". Read the short bulleted list under the subheading Properties of Measurement.
Here is how these properties apply to each scale:
- Nominal: Identity only.
- Ordinal: Identity + Magnitude.
- Interval: Identity + Magnitude + Equal Intervals.
- Ratio: Identity + Magnitude + Equal Intervals + True Zero.
A Visual Summary
This hierarchy and its implications can be summarized visually. The following chart is an excellent reference that connects the levels of measurement to their characteristics and the types of statistical analyses that are appropriate for each.
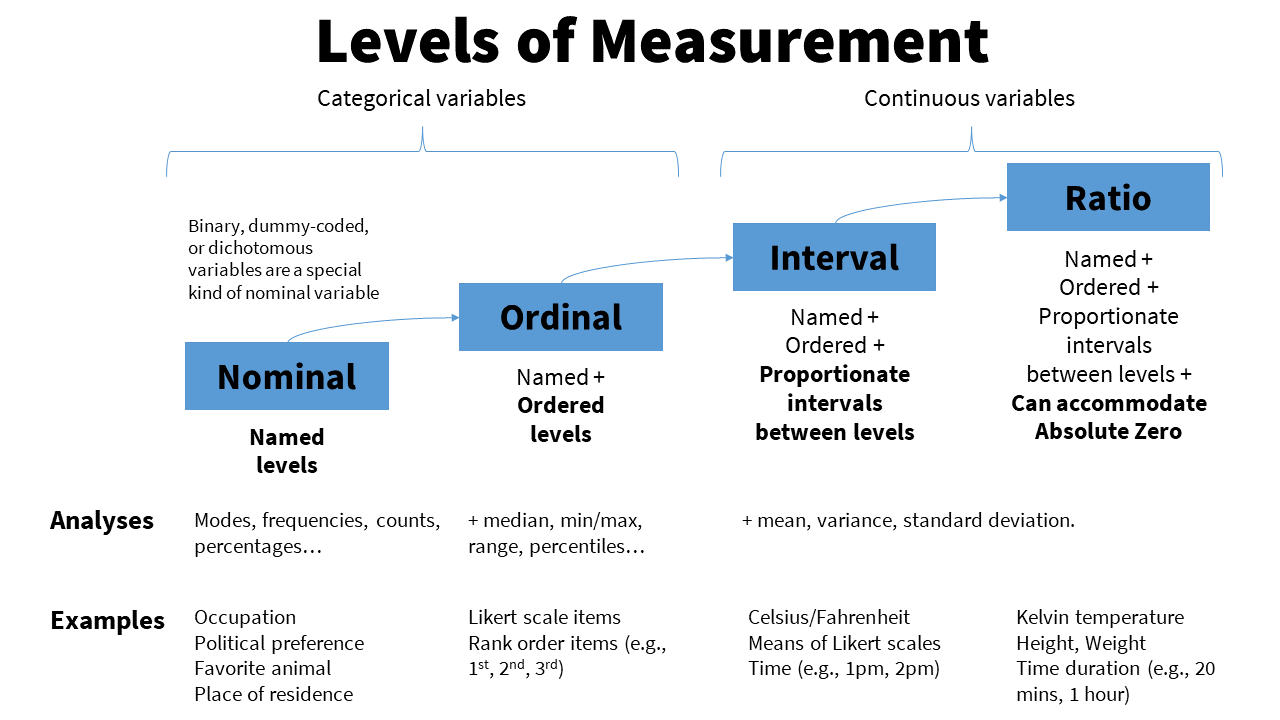
Notice how the possible analyses become more sophisticated as you move from Nominal to Ratio data. This brings us to the most important question.
Why Does This Classification Matter?
You might be wondering why we've spent time on this taxonomy. The reason is profoundly practical: the level of measurement of your data determines what you are allowed to do with it.
Choosing an inappropriate statistical test or machine learning algorithm for your data's measurement level can lead to flawed or completely meaningless results. For example:
- You cannot calculate a
meanfor nominal data. - You must use special encoding techniques (like One-Hot Encoding for nominal data vs. Ordinal Encoding for ordinal data) when preparing categorical features for a machine learning model.
- The choice between a bar chart (for nominal/ordinal) and a histogram (for interval/ratio) depends on the data type.
Let's read a final short piece that drives this point home.
Nominal, Ordinal, Interval & Ratio: Explained Simply - Grad Coach
This section from the Grad Coach article explicitly answers the "Why does it matter?" question.
Please read the section titled Why does it matter?. The key takeaway is that understanding these levels is essential for choosing the correct analytical tools.
Conclusion
In this lesson, we have dissected the fundamental ways data can be classified. You now have a framework for looking at any piece of data and categorizing it appropriately.
Key Takeaways:
- All data can be broadly classified as Qualitative (Categorical) or Quantitative (Numerical).
- A more detailed classification uses four hierarchical scales of measurement:
- Nominal: Labels without order (e.g., Country).
- Ordinal: Labels with a meaningful order but unequal intervals (e.g., Education Level).
- Interval: Ordered, with equal intervals but an arbitrary zero (e.g., Temperature in Celsius).
- Ratio: Ordered, with equal intervals and a true zero (e.g., Height).
- The level of measurement is not just a theoretical concept; it is a practical guide that determines which statistical methods and operations are valid.
We have established the types of data, but there is one more important distinction to make within quantitative data. In our next lesson, we will focus specifically on quantitative variables and learn to distinguish between discrete and continuous data.