Hello! In our last lesson, we completed our framework for classifying data by learning to distinguish between discrete and continuous variables. We now have a solid understanding of what data looks like. The logical next step in our statistical journey is to ask: where does data come from?
This lesson shifts our focus from the properties of data to the processes of its creation. We will be exploring the learning outcome: Identify common data collection methods such as surveys, experiments, and observational studies. Understanding these methods is fundamental because the way data is collected dictates the types of questions we can answer and the confidence we can have in our conclusions—especially when it comes to the critical difference between correlation and causation. This knowledge is indispensable in data science, where evaluating the origin and quality of a dataset is the first step toward building any meaningful model.
The Landscape of Data Collection
At a high level, there are three primary strategies for gathering data for a statistical study. We can:
- Observe a situation as it naturally occurs.
- Experiment by actively manipulating a variable to see its effect.
- Survey by asking a group of individuals questions.
Each of these methods has a different role, and comes with its own set of strengths and limitations. The choice of method depends entirely on the research question you want to answer.
This table provides an excellent overview of these three designs, comparing them across several key features. We will use it as a guide for our exploration in this lesson.
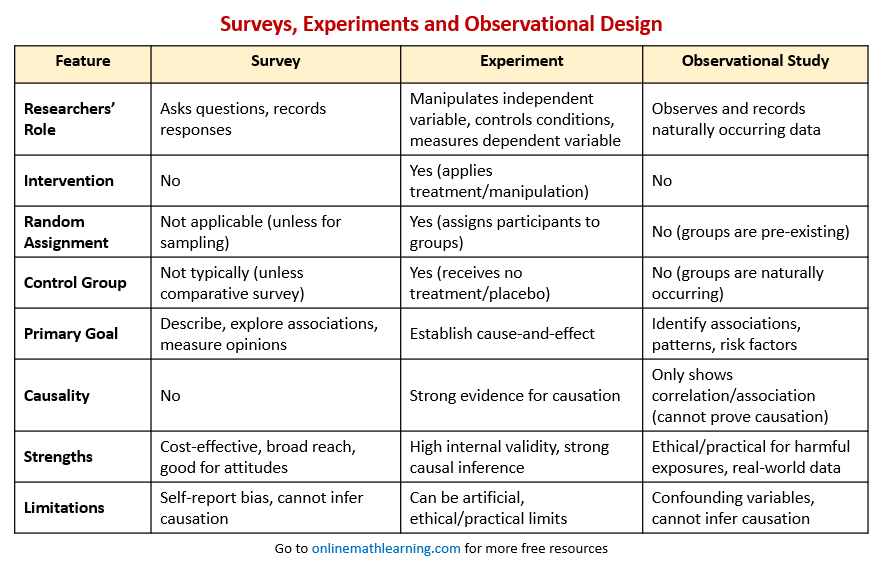
Let's begin by establishing formal definitions for these core approaches.
Surveys, Experiments, Observational Studies - MathBitsNotebook(A2)
This article from MathBitsNotebook provides clear, concise definitions for the three major types of statistical studies. It directly contrasts the passive nature of observation with the active intervention of experimentation.
Please read the following sections on the page: The definition of an Observational Study. Note the key phrases "does not influence the population" and "can only allow the researcher to claim association, not causation." The definition of Surveys, which are presented as a specific form of observational study. The definition of a Designed Experimental Study. Focus on the role of the researcher in "purposely attempting to influence the results" to determine a cause-and-effect relationship.
Observational Studies: Watching the World Go By
As you just read, the defining feature of an observational study is that the researcher is a passive collector of data. They measure or survey subjects without trying to change anything. Think of an ecologist counting the number of birds of a certain species in a park, or an economist tracking stock market prices.
The primary strength of this approach is that it allows us to study subjects or phenomena in their natural setting, which is particularly important when it would be unethical or impractical to perform an experiment. For example, to study the effects of smoking on lung health, you cannot ethically assign a group of people to start smoking. Instead, you would conduct an observational study, comparing the health outcomes of individuals who already smoke to those who do not.
However, this leads to the most significant limitation of observational studies: they cannot definitively prove causation. While you might observe that smokers have higher rates of lung cancer, you cannot conclude that smoking causes lung cancer from this study alone. There could be other, unmeasured variables—known as lurking or confounding variables—that are the true cause. For instance, perhaps people who choose to smoke also tend to have higher-stress lifestyles or different dietary habits, and these factors contribute to their health outcomes.
The following video provides a clear explanation of this critical distinction.
Observational Studies Versus Experiments
This video, "Observational Studies Versus Experiments," clearly articulates why observational studies are limited to showing association, not causation, due to the potential for lurking variables.
Please watch these key segments: This part defines an observational study and introduces the concept of lurking variables as the reason for not being able to determine causality. Here, the video contrasts this with an experiment, where deliberate manipulation allows for determining causality. Finally, watch the short summary at the end, which reinforces these core ideas.
Observational studies themselves can be categorized based on their relationship to time. This diagram illustrates three common designs:

Let's break down what this diagram shows:
- Cross-Sectional Study: Data is collected from a population at a single, specific point in time. It provides a "snapshot" of the group. A survey asking about current political opinions is a classic example.
- Prospective Study (or Cohort Study): Researchers identify a group of subjects (a cohort) and follow them forward in time, collecting data as events unfold. For example, tracking a group of recent computer science graduates over 10 years to see how their starting salaries and career choices evolve.
- Retrospective Study (or Case-Control Study): Researchers start with an outcome (e.g., a group of patients with a disease) and look backward in time to try to identify contributing factors. They compare this "case" group to a "control" group that does not have the outcome.
Experiments: The Power of Intervention
If observational studies are about watching, experiments are about doing. In an experimental study, the researcher deliberately applies a treatment to a group of subjects and measures the resulting outcome. This active manipulation is what allows experiments to establish cause-and-effect relationships.
The ability to infer causation stems from the core principles of experimental design, which are engineered to isolate the effect of the treatment from all other potential factors. Key components include:
- Control Group: A group that does not receive the treatment (or receives a fake treatment, a placebo). This group provides a baseline against which the treatment group can be compared.
- Random Assignment: Subjects are randomly assigned to either the treatment or control group. This is a crucial step that helps ensure the groups are similar in all respects before the treatment is applied, minimizing the risk of confounding variables.
Your background in computer science provides a great parallel: think of A/B testing in web development. To see if changing a button's color from blue to green increases clicks, you don't just change the button and watch the click rate. You randomly show some users the blue button (control group) and other users the green button (treatment group). By comparing the click rates between these two randomly assigned groups, you can confidently conclude whether the color change caused a difference in user behavior.
This video segment explains the principles of experimental design and introduces some essential vocabulary.
AP Statistics | Unit 3 Review | Collecting Data (EVERYTHING YOU NEED TO KNOW!!)
This video, from a review for AP Statistics, offers a fantastic, fast-paced overview of the distinction between observational studies and experiments, as well as the key vocabulary used in experimental design.
Please watch the following parts: First, watch the section that directly contrasts the two study types, from observational studies versus experiments. Next, review the key vocabulary of experiments, including the concepts of confounding, placebo, and blinding (single-blind and double-blind). "Blinding" refers to concealing whether a subject is in the treatment or control group to prevent the psychological placebo effect from biasing the results.
Surveys: The Art of Asking Questions
As we noted earlier, surveys are a tool for data collection, most often used within an observational study design. They involve asking a sample of a population a series of questions to gather information about their opinions, behaviors, or factual characteristics.
While seemingly straightforward, designing a good survey is a complex art. The way a question is worded, the people you choose to ask, and who chooses to respond can all introduce significant bias, corrupting the data and leading to incorrect conclusions.
For example:
- Wording Bias: Compare "Do you support a tax to improve public schools?" with "Do you support an additional tax on your income to fund government-run schools?" The phrasing can dramatically alter the responses.
- Non-response Bias: If you send out an email survey and only the people who feel very strongly about the topic respond, your results won't represent the entire population, but only the passionate subset.
- Undercoverage: If you conduct a survey via landline telephone, you systematically exclude people who only use mobile phones or have no phone at all, leading to a sample that doesn't accurately reflect the whole population.
This final clip highlights these common pitfalls.
AP Statistics | Unit 3 Review | Collecting Data (EVERYTHING YOU NEED TO KNOW!!)
This is the same video as before. Now, please focus on the section discussing common issues and biases that can arise in data collection, particularly with surveys.
Please watch the segment from bad sampling methods. This covers convenience sampling, voluntary response bias, undercoverage, non-response bias, and wording bias—all critical concepts for evaluating the quality of survey data.
Conclusion
In this lesson, we have mapped out the primary methods for collecting data in a statistical study. Understanding the distinction between observing and experimenting is arguably one of the most important foundational concepts in data analysis.
Key Takeaways:
- Observational Studies involve observing subjects without intervention. They are good for exploring associations and studying situations where experiments are not feasible, but they cannot prove causation due to potential confounding variables.
- Experiments involve deliberately manipulating a variable (treatment) and using random assignment and control groups to isolate its effect. They are the "gold standard" for establishing a cause-and-effect relationship.
- Surveys are a common tool for gathering data by asking questions. They are typically observational and are highly susceptible to biases related to sampling, question wording, and non-response.
We have now covered what data is, how it's classified, and where it comes from. However, data collected "in the wild" is rarely perfect. It often contains errors, missing values, and other inconsistencies. In our next lesson, we will begin our journey into data preprocessing, starting with why it's a necessary first step in any real-world data analysis project.